On this page: jump to a section
- Abbreviations
- 1. Overview
- 1.1. Scope
- 1.2. Key Assumptions
- 2. Business Requirements
- 2.1. Quarterly Monitoring Cycle
- 3. User Journeys
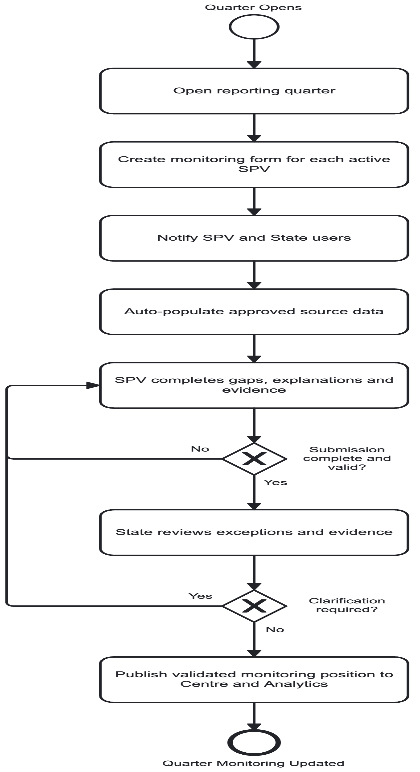
- 3.1. Overall User Journey
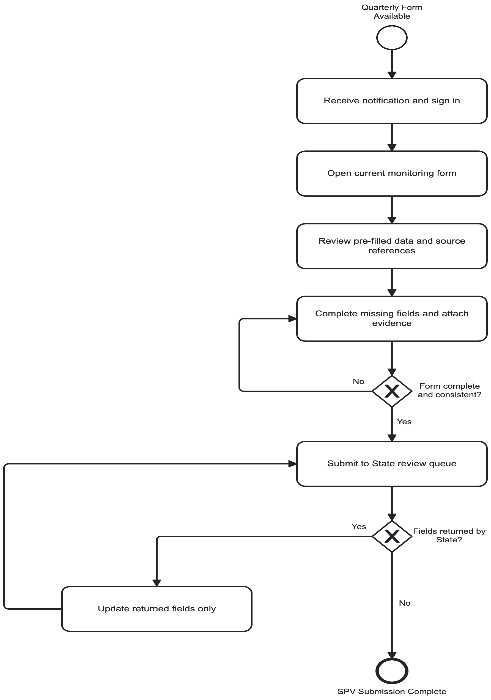
- 3.2. SPV User Journey
- 3.3. State User Journey
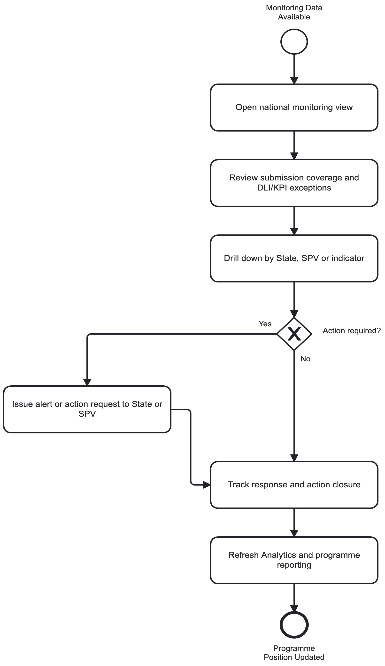
- 3.4. Central User Journey
- 4. Functional System Requirements
- 4.1. Monitoring Form Functional Areas
- 4.2. Detailed DLI Capture Requirements
- 4.3. KPI Monitoring and Calculation Requirements
- 4.4. KPI Scoring and Calculation Method
- 5. Solution Architecture
- 5.1. Data Layer
- 5.2. Platform Layer
- 5.3. User Access Layer
- 6. Nonfunctional Requirements
- 6.1. Performance and Data Freshness
- 6.2. Security and Role-based Access
- 6.3. Audit Trail and Data Quality
- 6.4. Availability, Backup and Recovery
- 6.5. Integration and Interoperability
- 6.6. Usability and Accessibility
- 6.7. Notifications and Alerts
- 7. Process Designs and Mockups
- 7.1. Quarterly Monitoring Process
- 7.2. Backend Information Flow
- 7.3. Q4 AOP Gate
- 7.4. SPV Monitoring Form Mockup
- 7.5. State Review Mockup
- 7.6. Centre Monitoring Mockup
- 8. Implementation Approach
- 8.1. Recommended First Release
- 8.2. Subsequent Enhancements
- 9. Annexure: PM-SETU KPI Framework
- 9.1. Cluster Level KPI - Funding Linked
- 9.2. Cluster Level KPIs - Monitoring KPIs
- 9.3. National Level KPIs
- 9.4. State Level KPIs


Detailed Project Report for PM-SETU Monitoring System
AbbreviationsPDF p.4
The abbreviations used throughout this Detailed Project Report are listed below in alphabetical order.
| Abbreviation | Expansion |
| AOP | Annual Operational Plan |
| API | Application Programming Interface |
| DLI | Disbursement-Linked Indicator |
| FMS | Fiduciary Management System |
| HSIC | Hub-and-Spoke ITI Cluster |
| IMA | Independent Monitoring Agency |
| ITI | Industrial Training Institute |
| IVA | Independent Verification Agency |
| KPI | Key Performance Indicator |
| LMS / LOMS | Learning Management System / Learning and Operations Management System |
| M&E | Monitoring and Evaluation |
| NPMU | National Programme Management Unit |
| SEDG | Socioeconomically Disadvantaged Group |
| SIDH | Skill India Digital Hub |
| SIP | Strategic Investment Plan |
| SPMU | State Programme Management Unit |
| SPV | Special Purpose Vehicle |
| SSO | Single Sign-On |
| UC | Utilization Certificate |
1. OverviewPDF p.5
PM-SETU will be delivered through multiple systems and implementation entities, but programme leadership needs one consistent view of progress across SPVs. This DPR defines the Monitoring System that will provide that view. It is designed as the quarterly non-financial reporting and review layer for PM- SETU, bringing DLI/KPI progress, implementation status, risks, audit actions, resource gaps and employment outcomes into one structured monitoring cycle.
The design follows a simple principle: reuse data before asking for data again. Information already available in LMS/LOMS, FMS/UC/Audit, SIDH/NCVT MIS, tracer and survey records, and approved programme records will be pre-filled. SPVs complete only the gaps, explanations and evidence that are not available elsewhere. The State reviews the submission, while Centre users and Analytics consume the same validated quarterly position. This reduces duplicate reporting and creates a reliable basis for programme review and action.
1.1. ScopePDF p.5
This DPR covers the business and system requirements required to run the quarterly monitoring cycle from form creation through SPV submission, State review and Centre oversight. The scope is deliberately focused on monitoring, validation and exception management; the underlying source systems remain responsible for creating and maintaining their own records.
- •Quarterly monitoring form covering DLI/KPI progress, project delivery, audit actions, resource gaps, risks and employment outcomes.
- •Auto-population from approved PM-SETU systems, with the source and last refresh date visible for each pre-filled value.
- •SPV input limited to missing information, variance explanations, corrective actions and supporting evidence.
- •State review and field-level return for correction, followed by Centre-level consolidation, exception monitoring and escalation.
- •Validated quarterly snapshots feeding Analytics and alerts, with Q4 submission completed before the next AOP is submitted.
1.2. Key AssumptionsPDF p.5
- •Financial transactions and detailed budget records remain in FMS. Monitoring only reads the status or references needed for programme oversight.
- •Quarterly capture is a PM-SETU operating cadence. Formal DLI reporting and independent verification continue at the frequency defined for each indicator.
- •Auto-filled fields are read-only unless a controlled exception is approved. The source system remains authoritative.
- •SPV, State and Centre users access the module through approved SSO and role/entity mapping.
- •DLI 4-6 are mainly State/Centre responsibilities. SPVs provide supporting cluster-level inputs only where specifically requested.
2. Business RequirementsPDF p.5
The Monitoring System is designed around one quarterly reporting cycle: the system pre-populates available information, the SPV completes only the gaps, the State reviews exceptions, and the Centre monitors the validated programme position. This section defines the business requirements needed to run that cycle consistently across all SPVs.
The requirements therefore follow the operating flow of the module: access and form creation, information capture, SPV submission, State review, and Centre monitoring. Detailed DLI-linked fields and system rules are defined in Section 3.
2.1. Quarterly Monitoring CyclePDF p.6
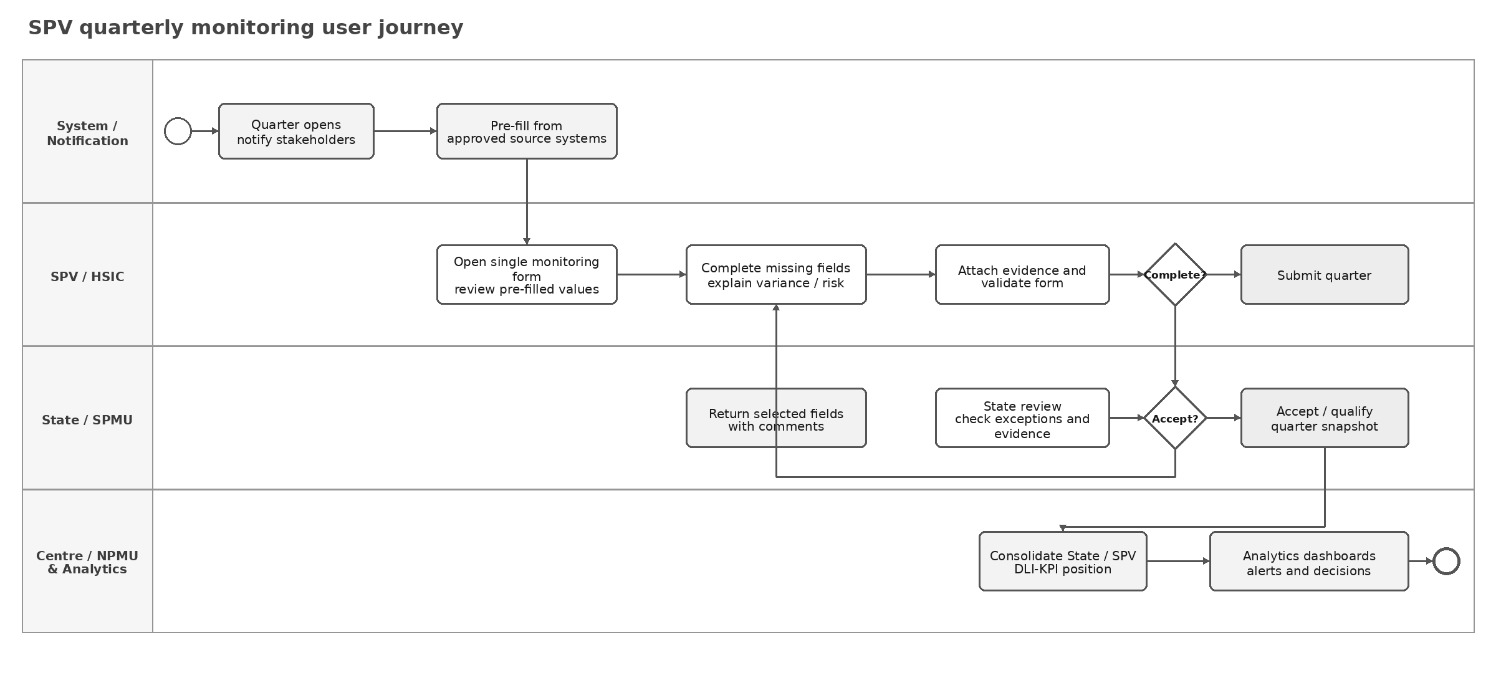
At the start of each quarter, the system opens a reporting for every active SPV/HSIC and notifies the relevant SPV and State users. The SPV accesses the current-quarter form through SSO. The form is pre- filled from approved source systems before any manual input is requested.
The SPV completes the remaining fields and submits the form after system validation. The State reviews the submission and may return only the fields that need clarification. Once reviewed, the same record becomes available for Centre monitoring, Analytics and alerts. For Q4, the monitoring form must be submitted before the next AOP can be initiated.
| Business requirement | Expected system behaviour |
| Quarter initiation | Create the reporting period for every active SPV/HSIC, notify SPV and State users, and display the due date. |
| Form Preparation | Load available source-system data before the form is opened for SPV action and identify fields requiring input. |
| SPV submission | Allow the SPV to complete pending fields, validate the form, and submit a time- stamped quarterly snapshot. |
| State review | Allow the State to accept the submission or return selected fields with comments and a due date; unaffected fields remain locked. |
| Centre monitoring | Provide consolidated submission coverage, DLI/KPI exceptions, overdue actions and State/SPV trends. |
| Analytics & alerts | Publish validated monitoring data to dashboards and generate reminders or threshold-based alerts. |
| Q4 / AOP control | Require Q4 monitoring submission before the SPV can submit the next Annual Operational Plan. |
3. User JourneysPDF p.6
3.1. Overall User JourneyPDF p.6
- •Quarter initiation: The system opens the reporting quarter,
creates one monitoring form for each active SPV and sends the due-date notification to SPV and State users.
- •Auto-population: Approved source systems populate
available fields first. Each pre-filled value carries its source and last-updated reference.
- •SPV completion: The SPV reviews pre-filled values,
completes only missing fields, explains deviations and attaches evidence where required.
- •Validation and State review: The system checks mandatory
fields and consistency. The State reviews exceptions and returns only the affected fields where clarification is needed.
- •Centre monitoring: Once the review position is available,
the same record feeds Centre monitoring, Analytics and alerts. No second data entry is required.
3.2. SPV User JourneyPDF p.7
- •Notification and access: The SPV receives the quarter-
open notification, signs in through approved SSO and opens the current monitoring form.
- •Review pre-filled data: The SPV checks data already
received from LMS/LOMS, FMS references, SIDH/NCVT MIS, surveys and other approved programme sources.
- •Complete gaps: Only fields that are not available from
source systems are opened for entry. The SPV adds the value, explanation and evidence as applicable.
- •Validate and submit: The system checks completeness and
basic consistency before allowing submission to the State review queue.
- •Return and resubmission: If the State returns specific
fields, the SPV updates only those fields and resubmits. In Q4, the form must be complete before the next AOP can be submitted.
3.3. State User JourneyPDF p.7
- •Review queue: The State sees all SPV submissions within
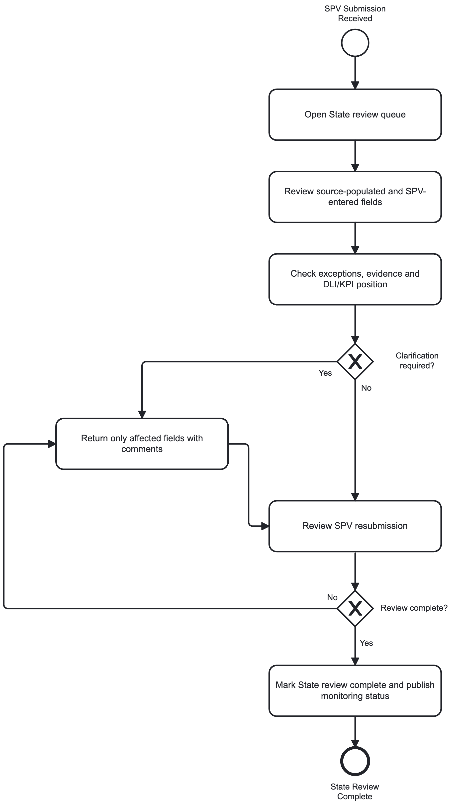
its scope, including pending, submitted, returned and reviewed status.
- •Data review: The reviewer checks source-populated values,
SPV-entered fields, evidence, DLI/KPI position and material exceptions.
- •Clarification: Where information is incomplete or
inconsistent, only the affected fields are returned with comments; the full form is not reopened.
- •Review completion: Once satisfactory, the State marks the
review complete. The updated position becomes available for State dashboards and Centre monitoring.
3.4. Central User JourneyPDF p.8
- •National monitoring view: Centre/NPMU users see
submission coverage, State/SPV status and DLI/KPI exceptions across the programme.
- •Drill-down: Users can move from the national view to a
State, SPV or indicator to understand the underlying exception and supporting record.
- •Action and alerts: Where intervention is required, the
system issues an alert or action request to the responsible State/SPV and tracks closure.
- •Analytics and reporting: Reviewed monitoring data is
reused in Analytics and programme reporting, giving Centre a current scheme-level position without additional data collection.
4. Functional System RequirementsPDF p.8
The functional requirements translate the business requirements above into DLI-linked fields, source ownership, SPV action, capture frequency and review responsibility. The quarterly view supports programme management; formal DLI verification continues under the approved verification arrangements.
4.1. Monitoring Form Functional AreasPDF p.8
The quarterly form captures the minimum information required to understand implementation progress, exceptions and outcomes. Wherever a trusted source exists, the system should pre-populate the field; the SPV should provide only missing information, explanations, actions or evidence.
| Functional area | Information captured | Primary source / entry | Frequency |
| Project planning | SIP/AOP milestones, target date, current status, delay/variance and next action. | SIP/AOP + Admin + SPV update | Quarterly |
| Internal audit tracking | Audit due/completed status, open observations, action owner, mitigation and due date. | FMS/Audit + SPV action | Quarterly |
| Proposal submission & evaluation | Proposal type, submission date, evaluation stage, pending action and outcome. | Admin / official records | Quarterly / event |
| Project tracking | Implementation milestone, planned vs actual date, progress status, delay reason and recovery action. | Admin + SPV update | Quarterly |
| Resource management | Trainer/staff vacancy, equipment/readiness gap, responsible owner and closure plan. | LMS/ITI + SPV action | Quarterly |
| Risk management | Risk statement, severity, likelihood, owner, mitigation, due date and residual status. | SPV + review workflow | Quarterly / change |
| Budget tracking reference | AOP approval, UC/audit status, utilization/compliance flag and variance reference; no financial transaction entry. | FMS - read only | Quarterly |
| Functional area | Information captured | Primary source / entry | Frequency |
| Real-time status | Latest integrated refresh, overdue items, submission/review state and outstanding actions. | Integrated sources | Near real- time / daily refresh |
| KPIs & success metrics | DLI/KPI target, current value, variance, source, evidence and exception action. | Integrated sources + SPV gap entry | Quarterly |
| Monitoring employment | Overall/female employment, six-month outcome, cohort coverage, self -employment evidence and missing tracer records. | Tracer / placement / LMS | Quarterly status; formal source yearly |
4.2. Detailed DLI Capture RequirementsPDF p.9
The quarterly form mirrors the programme DLIs but does not change their formal verification frequency. The system captures a quarterly management position, while formal annual or semi-annual verification remains separate.
DLI 1 — Employment outcomes of graduates from supported ITIs improved
| Sub- component | Information to capture | Formal target / reference | Source | SPV action | Capture | Review / monitor |
| Overall graduate employment | Employment within 6 months of certification; wage + self- employment; cohort and ITI coverage. | 75% of operational HSICs: 55% (2027/28), 65% (2028/29), 75% (2029/30). | Graduate tracer survey / placement records | Complete missing graduate outcomes; explain coverage gaps; attach evidence where source is incomplete. | Quarterly status; formal source yearly | State/NPMU monitoring; IVA formal verification |
| Female graduate employment | Female wage/self- employment within 6 months; female cohort and coverage. | 75% of operational HSICs: 45% (2027/28), 55% (2028/29), 65% (2029/30). | Tracer / placement records | Complete missing female outcome records; explain variance. | Quarterly status; formal source yearly | State/NPMU; IVA |
DLI 2 — Access to better-quality training programs of supported ITIs increased
| Sub- | Information to capture | Formal | Source | SPV action | Capture | Review / monitor |
| componen | target / | |||||
| t | reference |
Sub- componen t
Formal target / reference
| Sub- componen t | Information to capture | Formal target / reference | Source | SPV action | Capture | Review / monitor |
| Trainer industry / green training | Number and % of ITI trainers receiving industry- relevant training, industrial attachment and green-practice training. | 75% HSICs reach 15% of trainers (2026/27), 30% (2027/28), 50% (2028/29). | LMS/LOM S + official training records | Add missing trainer-training record/evidence ; explain shortfall and recovery action. | Quarterl y status | State/NPMU ; IVA annual field verification |
| Overall trainee enrolment vs SIP goal | Actual enrolment, SIP annual goal, % achieved, sanctioned/availabl e intake, trajectory and variance. | 75% of HSICs with 2+ years operation s achieve 80% of SIP overall enrolment goal. | LMS/LOM S / SIDH / NCVT MIS | Explain variance below trajectory; state corrective action and owner. | Quarterl y | State/NPMU ; IVA annual verification |
| Female & SEDG enrolment vs SIP goal | Female and SEDG enrolment, SIP target, % achieved and gap by cohort. | 75% of HSICs with 2+ years operation s achieve 80% of female & SEDG SIP enrolment goals. | LMS/LOM S / SIDH / NCVT MIS | Explain gap; record outreach / recovery action. | Quarterl y | State/NPMU ; IVA |
DLI 3 — Governance and management of supported ITIs strengthened
| Sub- compon ent | Information to capture | Formal target / reference | Source | SPV action | Captur e | Review / monitor |
| Merit- based leadershi p & manage ment | Appointment status, selection basis, female representation, management units (finance, academics, operations/M&E/placem ent/safety) and evidence. | 60% HSICs (2025/26), 65% (2026/27), 75% (2027/28) with merit-based leadership/mana gement. | Official progra mme / Admin records | Provide missing appointment/se lection evidence; update vacancy or action status. | Quarter ly status | State; IVA verificati on |
| Sub- compon ent | Information to capture | Formal target / reference | Source | SPV action | Captur e | Review / monitor |
| Industry chair | Board/governing body chair name, organization, industry status, appointment date and evidence. | 90% of onboarded HSICs have an industry chair. | Admin / official records | Provide missing appointment evidence only. | Quarter ly status | State; IVA |
| HSIC annual report | Publication status/link; revenue generation summary; surveys; KPIs; environment/social safeguards; greening of courses/infrastructure. | 90% of operational HSICs publish annual report from 2027/28 onward. | Official records / Admin | Provide report link, missing evidence and readiness status. | Quarter ly readine ss; annual publica tion | State/NP MU; IVA |
DLI 4 — State governance and leadership for an enabling environment for ITI ecosystem strengthened
| Sub- compo nent | Information to capture | Formal target / reference | Sour ce | SPV action | Captur e | Review / monitor |
| Authorit y delegat ed to HSICs | Government order/notification, effective date and delegated administrative/financial/procurement/ HR/management authority. | 100% participati ng States issue delegation order by 2026/27. | State offici al recor ds | SPV acknowled ges / supplies cluster evidence only if requested. | Quarte rly status; milesto ne | SPMU/SSC/ NPMU; IVA |
| Employ er / faculty / trainee / tracer surveys | Survey completion status, sample/coverage, publication of key findings, and unresolved data gaps. | 75% of participati ng States conduct required surveys and publish findings at specified milestone s. | State surv ey / trace r recor ds | Provide HSIC-level survey records where required. | Quarte rly progre ss; formal annual | State/NPMU; IVA |
| Sub- compo nent | Information to capture | Formal target / reference | Sour ce | SPV action | Captur e | Review / monitor |
| Annual State scheme status report | Publication status; HSIC achievements incl. female/SEDG; audit summary; survey results; dialogue messages; PAP snapshot. | 90% of eligible participati ng States publish comprehe nsive annual scheme status report. | State offici al recor ds | Provide cluster inputs/evid ence where requested. | Quarte rly readin ess; annual publica tion | SSC/NPMU; IVA |
| Stakeho lder dialogu es | Dialogue date, industries/civil society/departments represented, agenda, minutes, female/SEDG and green-jobs actions. | 75% of participati ng States conduct semi- annual dialogue at specified milestone s. | State offici al recor ds | Provide HSIC action points if assigned. | Quarte rly trackin g; formal semi- annual | State/NPMU; IVA |
| Replicat ion of good practice s | Approved recommendations / strategic plan, identified good practice, target non-programme ITIs and budget provision. | 75% participati ng States recomme nd replication by programm e close. | State offici al recor ds | Provide cluster good- practice evidence. | Quarte rly / milesto ne | SSC/NPMU; IVA |
DLI 5 — Quality of training at NSTIs increased
| Sub- component | Information to capture | Formal target / reference | Source | SPV action | Capture | Review / monitor |
| NSTI autonomy / SIP / industry representatio n | Autonomy status, approved SIP, industry representation on IMC, effective date and evidence. | 5 NSTIs meet autonomy + SIP + industry representatio n condition. | Official NSTI programm e records | Not applicabl e to SPV. | Quarterly status / mileston e | DGT/NPMU ; IVA |
| Sub- component | Information to capture | Formal target / reference | Source | SPV action | Capture | Review / monitor |
| COE establishment | COE established/functional , sector/theme, training activity and industry/international partnership evidence. | 5 COEs established and functional with strategic partnerships. | NSTI official records | Not applicabl e to SPV. | Quarterly status / mileston e | DGT/NPMU ; IVA |
| NSTI training goals | Training completed vs SIP goal; completion records and workshop/classroom evidence. | 5 NSTIs achieve 70% (2026/27), 80% (2027/28), 90% (2028/29) of overall training goals. | NSTI records | Not applicabl e to SPV. | Quarterly status | DGT/NPMU ; IVA |
DLI 6 — National governance and leadership strengthened
| Sub- compone nt | Information to capture | Formal target / reference | Source | SPV action | Capture | Review / monitor |
| PPD platform | Platform/committee status, public/private representation, meeting records, decisions and recommendations. | Functional PPD platform established for States with limited industry presence. | MSDE official records | Not applicable; HSIC evidence only if requested. | Quarterly status / mileston e | MSDE/NPM U; IVA |
| Course flexibility notification | Notification issued to States/HSICs/NSTIs; date, receipt/acknowledgem ent and coverage. | MSDE prepares and notifies course design/updat e flexibility. | MSDE official records | Acknowledg e receipt where required. | Mileston e; visible quarterly | MSDE/NPM U; IVA |
| National dialogue | Event date, participants, issues reviewed and actions on female/SEDG enrolment, completion and employment. | MSDE holds annual dialogue at specified milestones. | MSDE official records | Provide programme evidence if requested. | Quarterly readines s; annual event | MSDE/NPM U; IVA |
| Sub- compone nt | Information to capture | Formal target / reference | Source | SPV action | Capture | Review / monitor |
| Green courses aligned to industry | Number/share of courses with green practices/skills and evidence of industry alignment. | 50% of courses with green practices/skil ls developed in line with industry needs by HSICs/NSTI s. | Curriculu m + official records | Provide HSIC course evidence where applicable. | Quarterly progress / mileston e | MSDE/NPM U; IVA |
| NSC impact review / scaling | NSC meeting, evaluation report, course-correction decision, good practices and scaling plan. | NSC evaluates impact for course correction and later identifies good practices for scale-up. | NSC / official records | Provide cluster evidence where requested. | Quarterly status / mileston e | MSDE/NPM U; IVA |
4.3. KPI Monitoring and Calculation RequirementsPDF p.14
All KPIs defined under the PM-SETU KPI framework form part of the Monitoring System and are monitored alongside the DLIs above. The complete KPI definitions, weightages and year-wise targets are set out in Annexure A. For operational monitoring, the table below records the evaluation or calculation rule and the information the system is expected to present.
| KPI | Methodology of Evaluation (Formula / Criteria) | Description |
| Cluster-level funding-linked KPIs | ||
| Infrastructure Upgradation (Civil Works & Equipment) | Assessed in two equal parts: physical progress against the AOP plan and utilisation of CAPEX released during the year. Each part carries 5 points. | Shows whether planned civil works and equipment are progressing and whether released CAPEX is being used. |
| CTS Enrolment | Actual CTS enrolment is compared with the applicable AOP target. For scoring, fulfilment | Tracks whether the cluster is meeting its CTS |
| KPI | Methodology of Evaluation (Formula / Criteria) is capped at 100%. | Description enrolment plan. The Year 5 target varies with the cluster baseline. |
| CTS Pass Percentage | CTS trainees passed / CTS trainees appeared x 100. | Measures the share of CTS trainees who pass the examination in the assessment year. |
| Short-term Courses (Enrolment) | Eligible enrolment is compared with the AOP target. Only NSQF-aligned short-term courses of at least 240 hours are counted. | Tracks enrolment in qualifying short-term courses; the Year 5 reference is 300 trainees, subject to approved exceptions. |
| CTS Placement Rate Wage Improvement | CTS trainees placed / CTS trainees passed x 100. (Average wage in assessment year - baseline average wage) / baseline average wage x 100. | Tracks placement of CTS graduates. Placement includes wage employment, self- employment or entrepreneurship, apprenticeship and higher education. Measures improvement in the average wage of placed trainees against the Year 1 baseline. |
| Women & SC/ST Participation Female Placement | Women enrolled / total enrolled x 100, and SC/ST enrolled / total enrolled x 100. The two measures carry 2.5 points each. Female CTS trainees placed / female CTS trainees passed x 100. | Tracks participation of women and SC/ST trainees separately within the cluster. Tracks placement outcomes for female CTS trainees using the same placement definition as the overall CTS placement KPI. |
| Existing CTS Trades | Existing CTS courses upgraded / existing | Tracks progress in |
| KPI | Methodology of Evaluation (Formula / Criteria) | Description |
| Upgradation | CTS courses proposed for upgradation in the SIP x 100. | upgrading existing CTS trades against the cluster SIP. |
| New CTS Courses | New CTS courses operationalised / new CTS courses proposed in the SIP x 100. | Tracks commissioning of new CTS courses committed in the SIP. |
| New Short-term Courses Trainer Vacancy | New short-term courses introduced / new short-term courses proposed in the SIP x 100. Trainer vacancies filled / trainer vacancies identified for upgraded and new trades x 100. | Tracks new short-term courses introduced by the cluster; the five-year framework requires at least 10 qualifying courses. Tracks closure of trainer vacancies required for the upgraded and newly introduced trades and units. |
| Trainer Upskilling | Trainers upskilled / total trainers x 100. | Measures the proportion of trainers who have completed the required upskilling. |
| Cluster-level monitoring KPIs | ||
| Pathways for Sustainable Industry Participation Industry Validation of Learning Outcomes | Count qualifying industry tie-ups for OJT, apprenticeships, placements, industry-led training and production centres. Production centres count from Year 3; other partnerships from Year 2. Annual industry feedback on trainees undertaking OJT, apprenticeships or placements, using the modality issued by DGT. | Tracks the depth of sustained industry participation in cluster delivery and learner pathways. Checks whether employers validate the learning outcomes demonstrated by trainees in workplace settings. |
| Revenue from Non- Government Sources | Revenue generated through SPV operations / annual operating cost x 100. | Tracks the share of annual operating cost supported through |
| KPI | Methodology of Evaluation (Formula / Criteria) | Description |
| industry, CSR or production-centre revenue. | ||
| Annual Consolidated Report | Report issued by the end of the first quarter of the succeeding financial year. | Tracks timely publication of the cluster annual report. |
| Drop out Percentage | Dropped-out candidates / total enrolled candidates x 100. Reasons for dropouts are recorded by the SPV. | Tracks learner attrition and the reasons requiring corrective action. |
| National-level KPIs | ||
| Adoption of Industry-led SPV Model at HSICs Total number of Trainers Trained | Formation of SPVs by selected AIPs; monitored against the annual 90% target. Count of trainers trained during the financial year against the annual programme target. | Tracks adoption of the industry-led SPV operating model across selected HSICs. Tracks annual trainer- training delivery at national level. |
| State-level KPIs | ||
| Vacancy Fulfilment of Trainers in Non-PM-SETU ITIs | Trainer vacancies filled / total trainer vacancies identified in non-PM-SETU ITIs in the State x 100. | Tracks the State position on filling trainer vacancies outside PM-SETU ITIs. |
| Percentage of trainers that have undergone trainings under Component II of PM- SETU | Trainers completing Component II training / trainers with more than 3 years experience in ITIs as on 31 March of the preceding financial year x 100. | Tracks coverage of Component II training among the eligible State trainer base. |
4.4. KPI Scoring and Calculation MethodPDF p.17
For funding-linked KPIs, the system applies only the KPIs relevant to the reporting year. The calculation follows the method used in the KPI framework sample calculations: achievement is compared with the applicable target, fulfilment is capped at 100% for scoring, and the result is multiplied by the KPI weightage. The overall score is normalised against the weightage applicable in that year.
| Calculation step | System treatment |
| Calculation step | System treatment |
| Raw fulfilment | Actual achievement / applicable target x 100. |
| Capped fulfilment Weighted score | Use the lower of raw fulfilment and 100% so achievement above target does not increase the KPI beyond its assigned weightage. Capped fulfilment x KPI weightage / 100. |
| Normalised score CAPEX release treatment | Sum of weighted scores / sum of weightages applicable in the year x 100. Where the normalised weighted KPI score is 75% or above, 100% of the eligible CAPEX tranche is released. Where it is below 75%, the eligible CAPEX tranche is released proportionately as: Eligible CAPEX x (Normalised KPI Score / 75). |
| Illustrative Year 2 example | CTS enrolment of 1,890 against an AOP target of 1,800 gives raw fulfilment of 105%; this is capped at 100%, giving the full 10.00 points against a weightage of 10. |
5. Solution ArchitecturePDF p.18
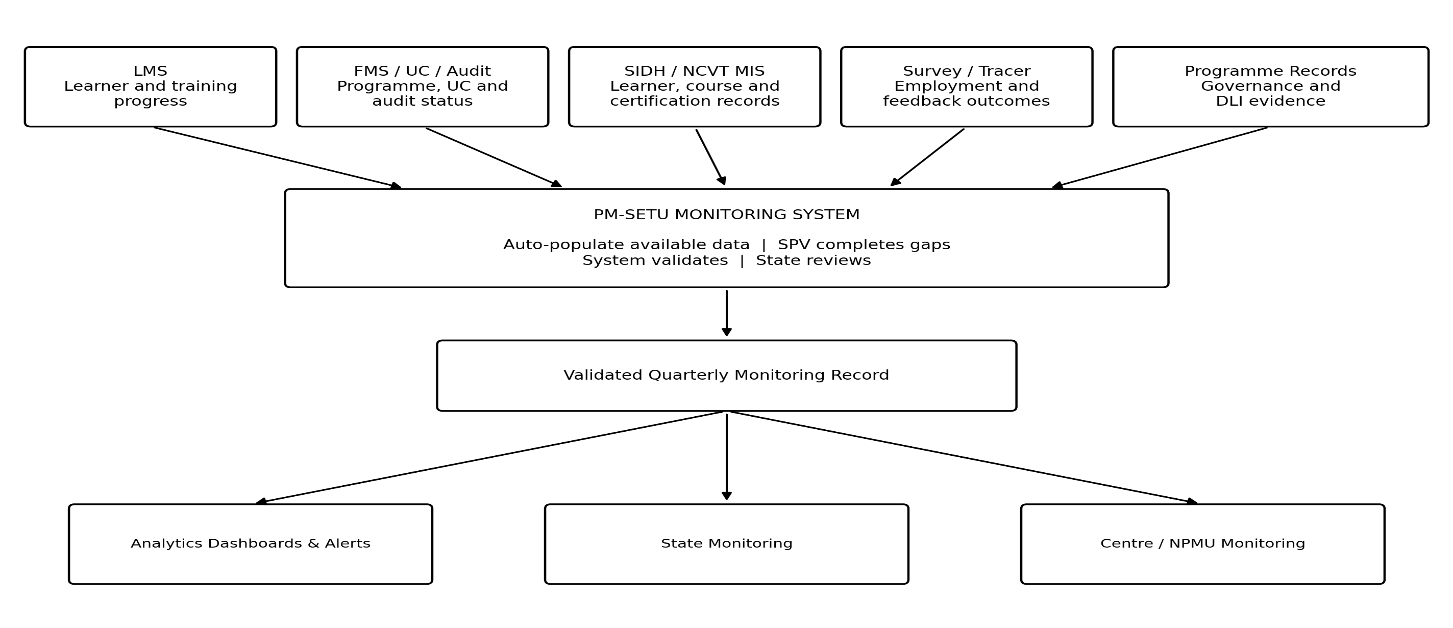
The Monitoring System will bring together the information required for quarterly PM-SETU monitoring. Data already available in connected systems will be pulled into the monitoring form automatically. The SPV will complete only the information that is unavailable, after which the State will review the submission. Reviewed information will feed the Analytics module and Centre-level monitoring.
5.1. Data LayerPDF p.19
The data layer identifies what Monitoring receives from each source and why it is required. Source systems remain responsible for maintaining their own records.
- •LMS: provides learner enrolment, attendance, course completion and trainer-training information required to track training delivery. Placement or employment records may also be used where maintained in the LMS.
- •FMS / UC / Audit: provides SIP/AOP references, utilization-certificate status, audit status and compliance flags needed to track implementation and open actions. Detailed financial transactions remain in FMS.
- •SIDH / NCVT MIS: provides available learner, course, institution and certification records so that approved information is not requested again from the SPV.
- •Survey / tracer records: provide graduate employment outcomes, female employment outcomes and employer, faculty and trainee feedback used for outcome monitoring.
- •Official programme records: provide governance orders, leadership and board evidence, annual reports, programme decisions and NSTI records required for DLI/KPI monitoring.
5.2. Platform LayerPDF p.19
The platform layer turns source data and SPV inputs into one reviewed quarterly monitoring record.
- •Bring data into Monitoring: use APIs where systems support them and controlled batch exchange where they do not.
- •Check incoming information: verify the reporting quarter, common identifiers, duplicate records, source freshness and mandatory evidence before the data is used.
- •Prepare the quarterly form: pre-fill available information, keep source-populated values read-only and open only the fields that require SPV input, explanation or evidence.
- •Create the quarterly record: lock the submitted version so the programme has one traceable position for that quarter; later source updates remain separately identifiable.
- •Manage follow-up: send reminders for quarter opening, overdue submissions, returned fields, stale source data and material DLI/KPI exceptions.
- •Feed Analytics: send reviewed monitoring records with their source, reporting period and data-quality status for dashboards, alerts and programme review.
5.3. User Access LayerPDF p.19
Access is role-based. Each user sees only the forms, review actions and dashboards required for their PM-SETU responsibility.
| Stakeholder | Access / responsibility |
| SPV / HSIC | Review auto-filled data; complete gaps; explain exceptions; upload evidence; submit / resubmit returned fields. |
| SPMU / SSC | Track SPV completion, review submitted information, return selected fields for correction and use State-level dashboards to monitor exceptions. |
| NPMU / MSDE | View the national monitoring position, DLI/KPI trends, overdue submissions and material risks; use Analytics dashboards and alerts for programme decisions and escalation. |
| IMA / IVA | Consume relevant evidence for independent monitoring / verification; does not replace formal verification procedure. |
6. Nonfunctional RequirementsPDF p.20
The Monitoring System should remain reliable through each quarterly reporting cycle, protect programme information and work consistently with the other PM-SETU modules. The requirements below define the minimum service, security and usability conditions for the platform.
6.1. Performance and Data FreshnessPDF p.20
- •Display the latest successful refresh time for source-populated information so users can see how current the data is.
- •Load the latest available values without making the SPV wait for a new source-system refresh.
- •If a source is temporarily unavailable, retain the last available value and clearly mark it as stale or provisional until the next successful refresh.
- •Quarterly form generation, validation, submission and review should continue without being blocked by a slow external source.
6.2. Security and Role-based AccessPDF p.20
- •Provide role-based access for SPV/HSIC, State, Centre and authorised monitoring or verification users. Each user should see only the records and actions relevant to their role and entity.
- •Source-populated fields should remain read-only. Any permitted correction should capture the reason, supporting evidence and user making the change.
- •Lock submitted quarterly records. Corrections should follow a controlled return-and-resubmit or amendment process.
- •Apply the same access controls to forms, dashboards, exports and system integrations.
6.3. Audit Trail and Data QualityPDF p.20
- •Maintain a complete history of source refreshes, SPV entries, evidence uploads, validations, State review, returns, resubmissions and final status.
- •Use common programme identifiers for SPV/HSIC, institution, learner, course and reporting period to reduce duplicate or mismatched records.
- •Validate mandatory fields, reporting period, source freshness and required evidence before submission.
- •Pass source, reporting period, validation status and provisional-data flags with monitoring data sent to Analytics.
6.4. Availability, Backup and RecoveryPDF p.20
- •Keep the Monitoring System available during quarterly reporting and review windows, with planned maintenance communicated in advance.
- •Back up submitted forms, evidence and audit records so an application or integration failure does not result in loss of monitoring information.
- •Restore the latest verified monitoring record after a failure and retain the audit history of subsequent corrections.
6.5. Integration and InteroperabilityPDF p.20
- •Use standard APIs for connected PM-SETU systems where available; use controlled batch exchange where an API is not available.
- •Integration failure in one source should not stop the complete monitoring form. Affected fields should be flagged for follow-up.
- •Use agreed common identifiers and reporting-period definitions across Monitoring, LMS, FMS/UC/Audit and Analytics so records can be reconciled consistently.
6.6. Usability and AccessibilityPDF p.21
- •Keep the quarterly monitoring form as a single, guided interface with clear separation between auto - filled information, SPV inputs and fields returned for correction.
- •Show validation messages against the relevant field and state the action required in simple language.
- •Support standard accessibility practices for keyboard use, readable labels and screen-reader compatible form controls.
- •Allow users to save progress before final submission where manual information or evidence is still being compiled.
6.7. Notifications and AlertsPDF p.21
- •Notify relevant users when a quarterly form opens, approaches its due date, becomes overdue, is returned for correction or is accepted.
- •Generate alerts for material DLI/KPI exceptions and stale source information without creating duplicate alerts for the same unresolved issue.
- •Keep notification status linked to the underlying monitoring record so follow-up can be tracked.
7. Process Designs and MockupsPDF p.21
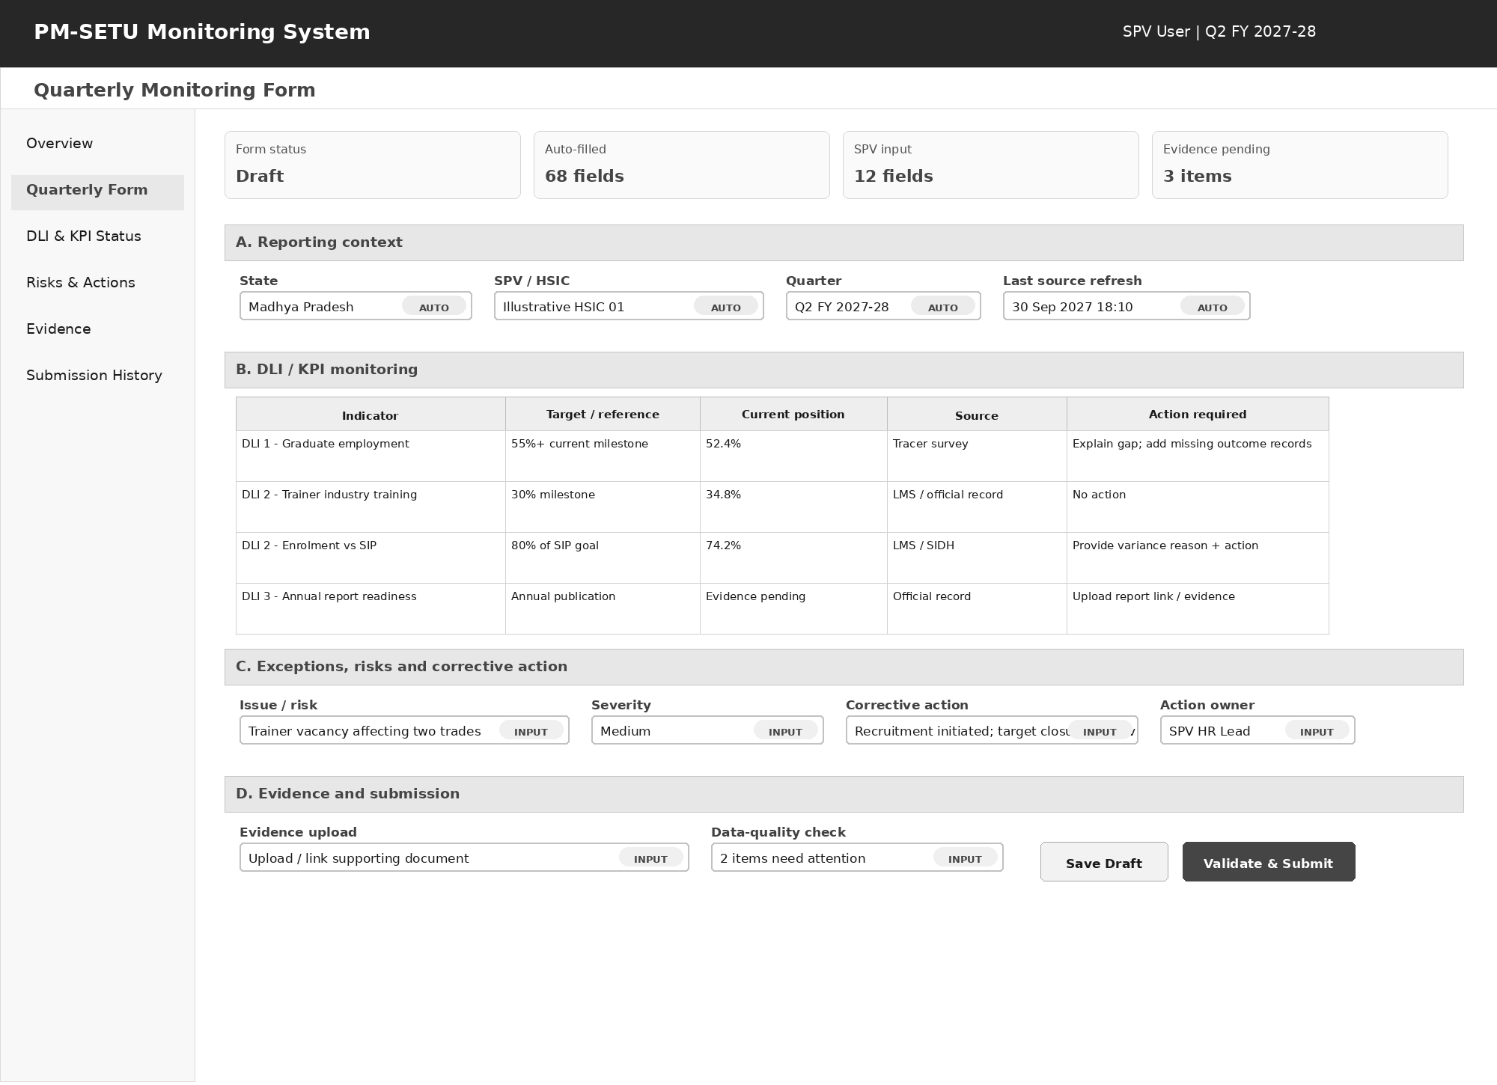
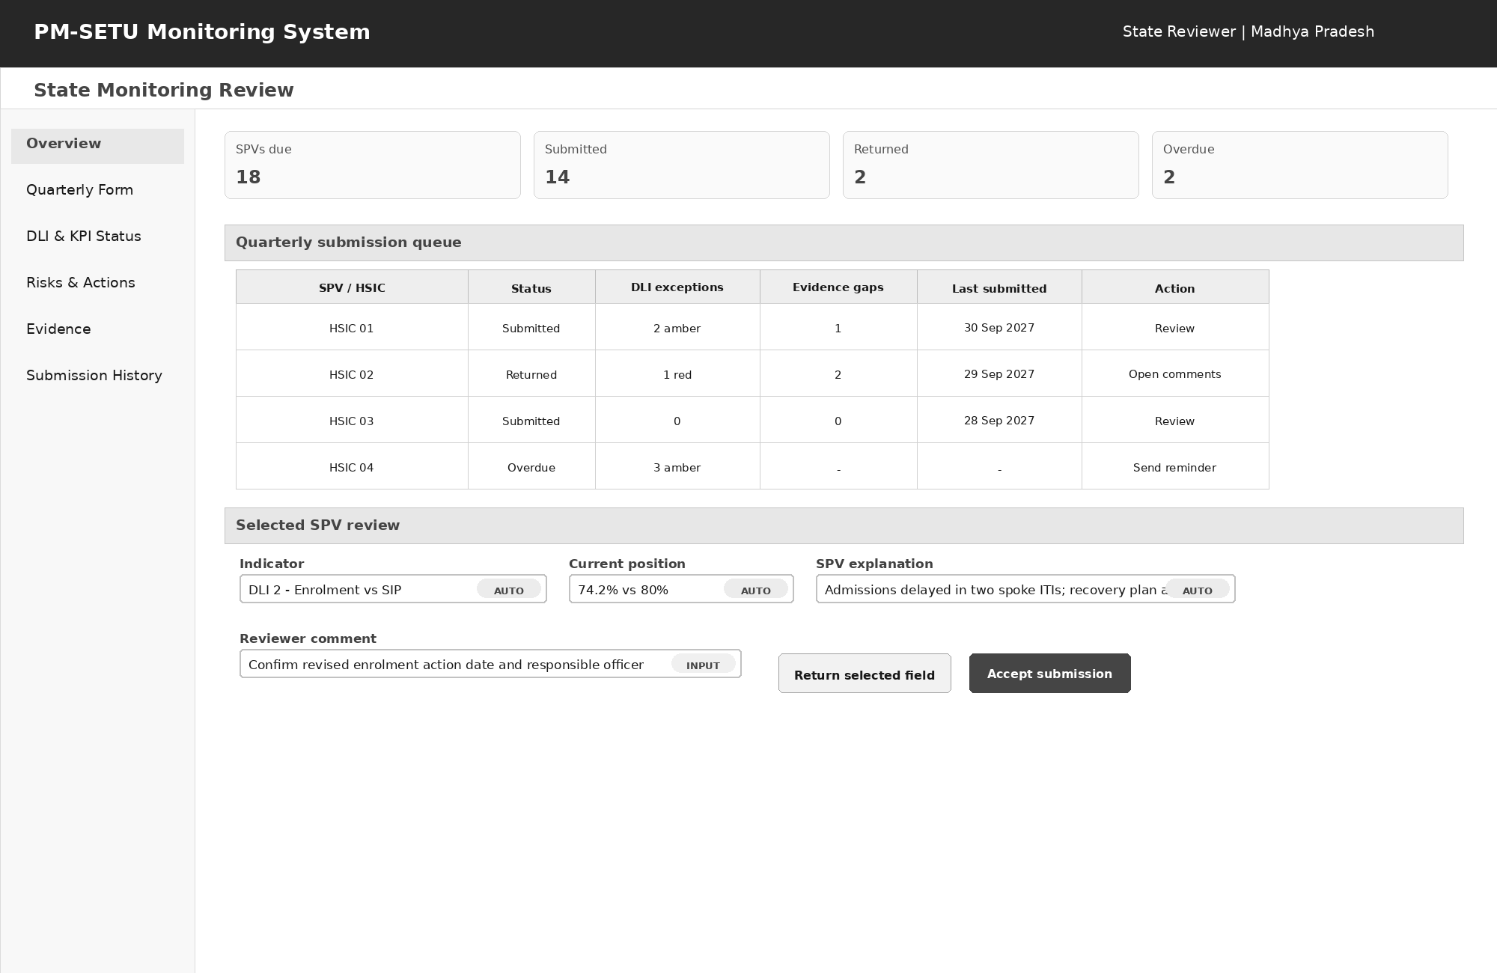
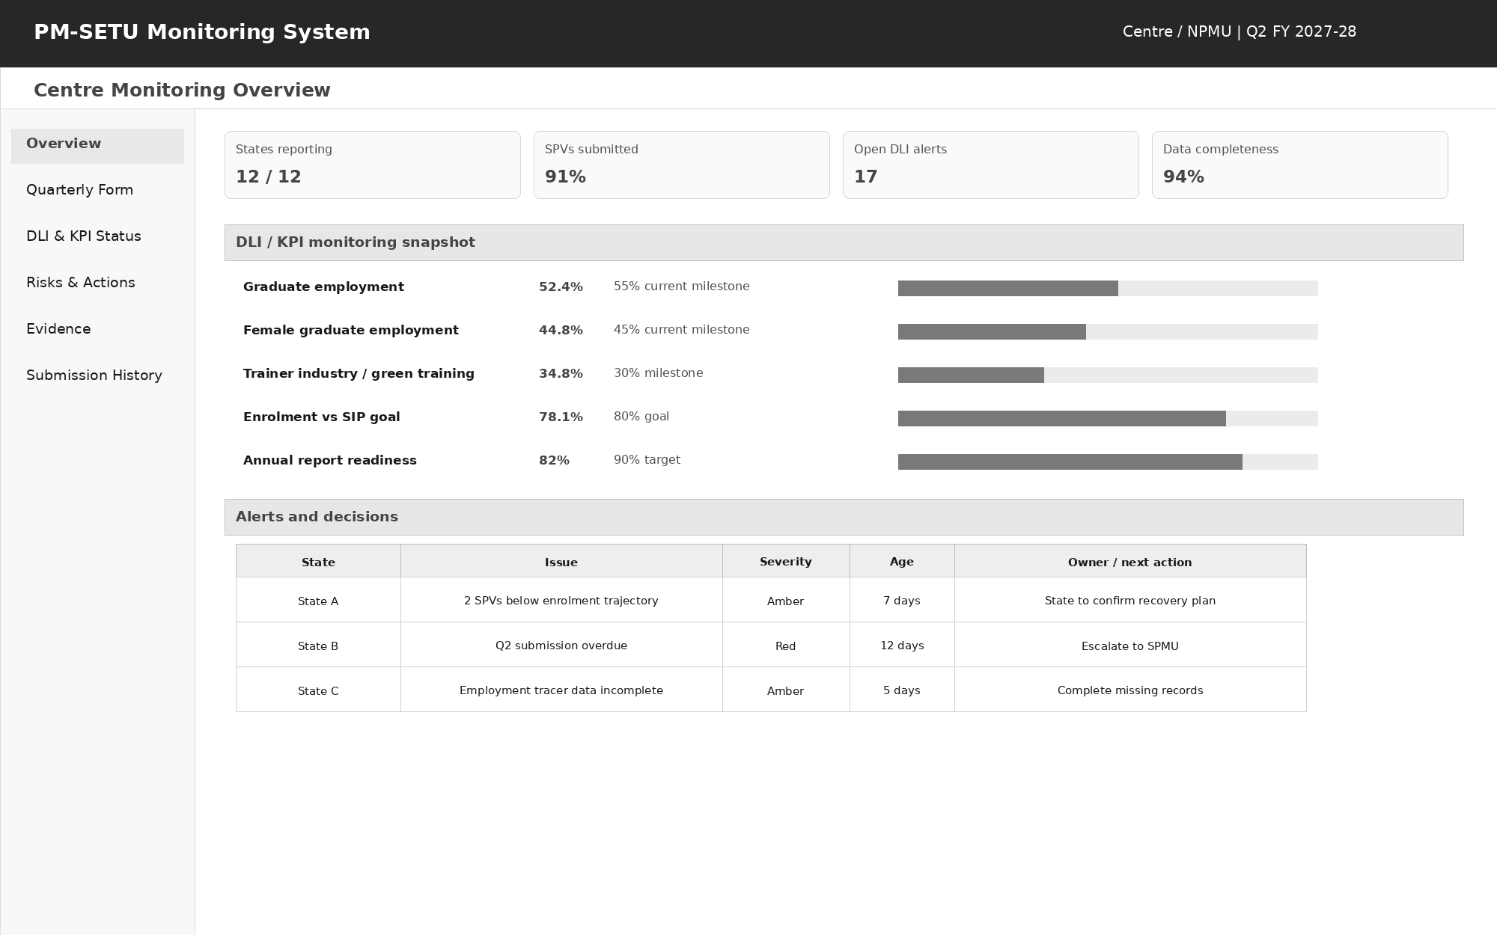
The process designs below use the same swimlane/BPMN treatment as the other PM-SETU DPRs. The mockups illustrate screen structure and workflow intent; values are illustrative only.
7.1. Quarterly Monitoring ProcessPDF p.21
The quarterly process begins with notification and source pre-fill. The SPV works only on missing information and exceptions. The State can return selected fields rather than the complete form. Accepted quarterly snapshots feed Centre monitoring and Analytics.
7.2. Backend Information FlowPDF p.22
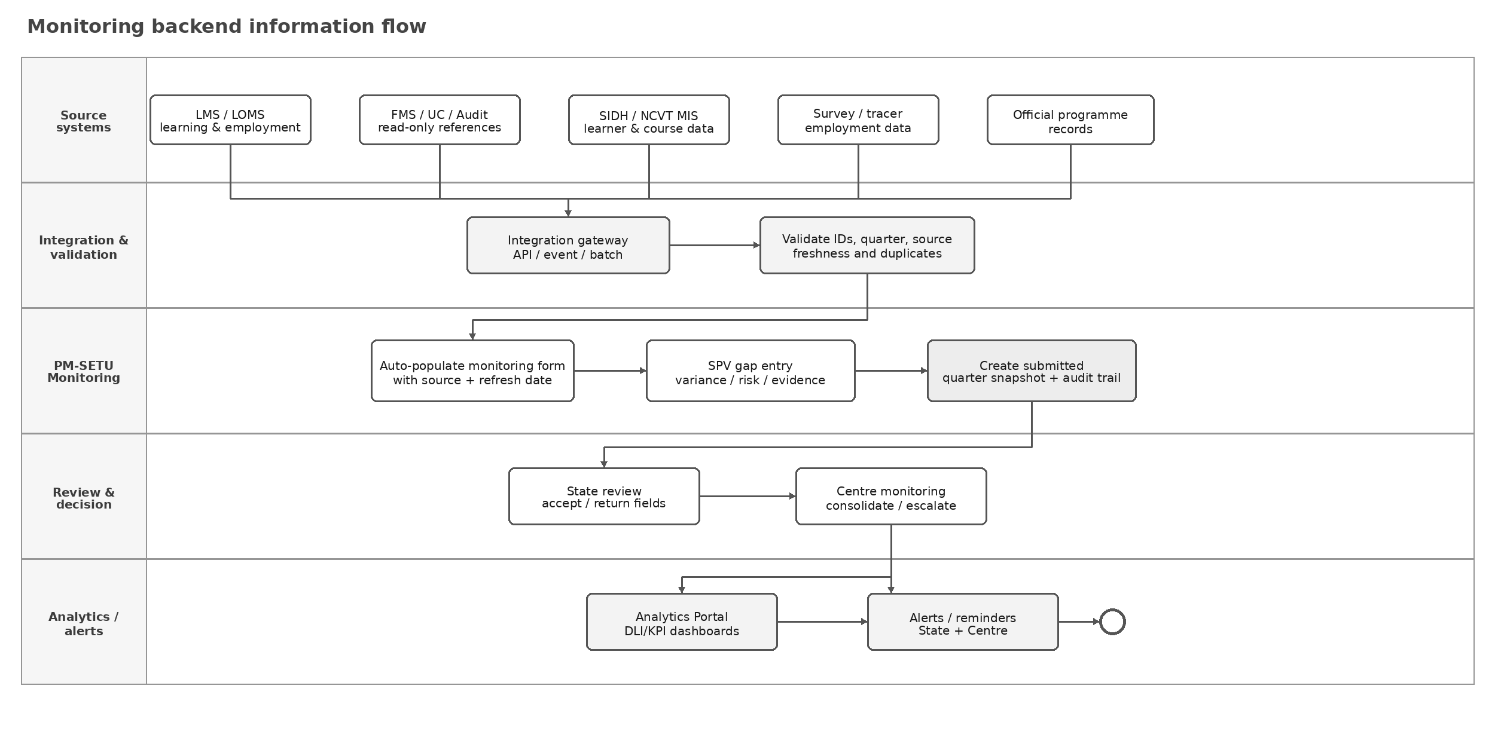
Source systems feed a common integration and validation layer. Monitoring combines validated source data with SPV-entered gaps, creates an auditable quarter snapshot, and passes qualified information to State/Centre review, Analytics and alerts.
Figure 3 — Process design: source-system capture to Monitoring, review, Analytics and alerts.
7.3. Q4 AOP GatePDF p.22
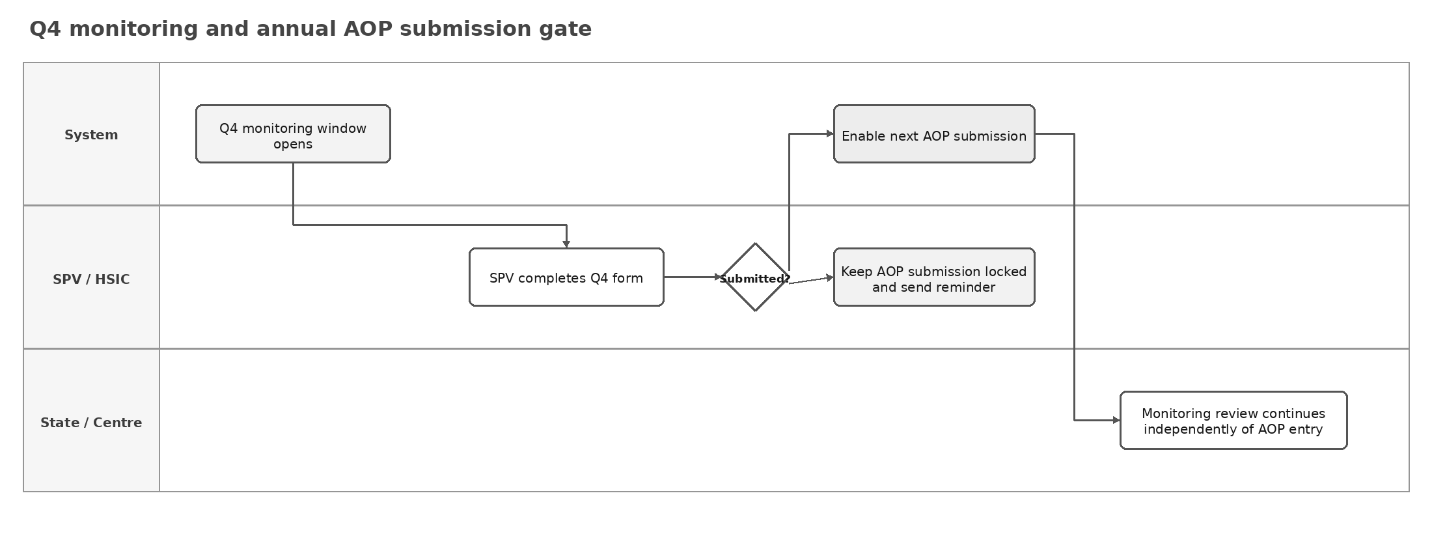
The Q4 control is intentionally simple: the next AOP entry is enabled after the SPV submits the Q4 monitoring form. State/Centre review may continue independently so the gate improves data discipline without creating an unnecessary approval bottleneck.
7.4. SPV Monitoring Form MockupPDF p.23
The SPV sees one consolidated page with reporting context, auto-filled DLI/KPI values, only the actions that require SPV input, risk/corrective-action fields, evidence and a final validation/submission control.
7.5. State Review MockupPDF p.24
State users see the quarterly submission queue, DLI exceptions and evidence gaps. Review is field-level: the State can return only the information requiring correction and accept the rest of the submission.
7.6. Centre Monitoring MockupPDF p.25
Centre users receive a programme-wide monitoring view focused on submission completeness, DLI/KPI position, data quality and exceptions requiring decision or escalation. Detailed operational records remain in the source systems.
8. Implementation ApproachPDF p.26
8.1. Recommended First ReleasePDF p.26
- •Single quarterly form with SSO, role/entity mapping, source tags, State review and submission history.
- •Priority pre-fill from LMS, FMS status/UC/Audit, SIDH/NCVT MIS, tracer/survey and official programme records.
- •DLI 1-6 monitoring structure, project/resource/risk tracking, evidence upload, validation and alerts.
- •Field-level return/resubmission so SPVs do not repeat the full submission.
- •Q4 submission gate before the next AOP can be entered.
- •Analytics feed containing qualified quarterly records with source and data-quality flags.
8.2. Subsequent EnhancementsPDF p.26
- •Increase API/event integrations and reduce batch/manual source updates.
- •Automate evidence checks where authoritative systems expose reliable document/status APIs.
- •Use operating data to refine exception rules, risk scoring and targeted reminders after the first implementation cycles.
9. Annexure: PM-SETU KPI FrameworkPDF p.27
The tables below provide the complete KPI framework used by the Monitoring System. They retain the KPI categories, weightages, annual applicability and targets from the approved KPI document. The operational calculations in Section 3 use these definitions and do not create a separate set of indicators.
9.1. Cluster Level KPI - Funding LinkedPDF p.27
| KPI No. | Key Performance Indicator | Weightage | Methodology of Evaluation | Y1 | Y2 | Y3 | Y4 | Y5 |
| 1 | Infrastructure Upgradation (Civil Works & Equipment) | 10 | Progress as per IMA evaluation and utilisation of released CAPEX amount. | AOP | AOP | AOP | AOP | AOP |
| 2 3 | CTS Enrolment CTS Pass Percentage | 10 10 | Actual enrolment against AOP target. Year 5: baseline <50% -> >=75%; baseline 50%- <75% -> >=85%; baseline >=75% -> >=95%. Passed / Appeared x 100. | - - | AOP - | AOP AOP | AOP AOP | Baseline- linked target >= 90% |
| 4 | Short-term Courses (Enrolment) | 5 | Only NSQF-aligned courses of at least 240 hours count; target may be amended for specific States/UTs through SIP with NSC approval. | - | AOP | AOP | AOP | 300 |
| 5 | CTS Placement Rate | 10 | Placed / Passed x 100. CTS only; placement includes wage employment, self- employment/entrepreneurship, apprenticeship and higher education. | - | - | AOP | AOP | >= 75% |
| 6 | Wage Improvement | 5 | (Assessment-year average wage - baseline average wage) / baseline average wage x 100. | - | - | - | AOP | >= 50% |
| 7A | Women Participation | 2.5 | Women enrolled / total enrolled x 100. | - | AOP | AOP | AOP | SIP |
| 7B 8 Female Placement | SC/ST Participation | 2.5 5 Female CTS trainees placed / female CTS trainees passed x 100; same placement definition as KPI 5. | SC/ST enrolled / total enrolled x 100. | - - | AOP - | AOP AOP | AOP AOP | SIP >= 75% |
| 9 | Existing CTS Trades Upgradation | 10 | Existing CTS courses upgraded / courses proposed for upgradation in SIP x 100. | - | AOP | AOP | AOP | 10 per Hub / 8 per Spoke |
2 CTS Enrolment 10
8 Female Placement 5
| KPI No. | Key Performance Indicator | Weightage | Methodology of Evaluation | Y1 | Y2 | Y3 | Y4 | Y5 |
| 10 | New CTS Courses | 10 | New CTS courses operationalised / courses proposed in SIP x 100. | - | AOP | AOP | AOP | 4 per Hub / 2 per Spoke |
| 11 | New Short-term Courses | 5 | New short-term courses introduced / courses proposed in SIP x 100. At least 10 over five years should be NSQF aligned and minimum 240 hours. | - | AOP | AOP | AOP | 10 |
| 12 | Trainer Vacancy | 10 | Vacancies filled / vacancies identified for upgraded and introduced trades and units linked to NIMS portal x 100. | - | AOP | AOP | AOP | >= 90% |
| 13 | Trainer Upskilling | 5 | Trainers upskilled / total trainers x 100. | - | AOP | AOP | AOP | >= 95% |
9.2. Cluster Level KPIs - Monitoring KPIsPDF p.28
| KPI No. | Key Performance Indicator | Target / measuring method | Y1 | Y2 | Y3 | Y4 | Y5 | |
| 1 | Pathways for Sustainable Industry Participation | Number of tie-ups with industries for OJT / apprenticeships / placements / industry-led training / production centres. Production centres count from Year 3; other partnerships from Year 2. | - | AOP | AOP | AOP | SIP | |
| 2 3 | Industry Validation of Learning Outcomes Revenue from Non- Government Sources (Industry, CSR or Production Centers) | Annual industry feedback on trainees as part of OJT / apprenticeships / placements; modality to be issued by DGT. Revenue generated through SPV operations / annual operating cost x 100. | Annual industry feedback on trainees as part of OJT / apprenticeships / placements; modality to be issued by | - - | - - | 70% - | 80% >= 25% | 90% >= 30% |
| 4 | Annual Consolidated Report | Issue annual report by end of first quarter of succeeding FY. | AOP | AOP | AOP | AOP | AOP | |
| 5 | Drop out Percentage | Dropped-out candidates / total enrolled candidates x 100; SPV records reasons for dropout. | - | - | <= 20% | <= 15% | <= 10% |
- - 70% 80% 90%
9.3. National Level KPIsPDF p.29
| KPI No. | Key Performance Indicator | Target / measuring method | Y1 | Y2 | Y3 | Y4 | Y5 |
| 1 | Adoption of Industry- led SPV Model at HSICs | Formation of SPVs by selected AIPs | 90% | 90% | 90% | 90% | 90% |
| 2 | Total number of Trainers Trained | Number of trainers trained in a financial year | 5,000 | 7,500 | 10,000 | 12,500 | 15,000 |
9.4. State Level KPIsPDF p.29
| KPI No. | Key Performance Indicator | Target / measuring method | Y1 | Y2 | Y3 | Y4 | Y5 |
| 1 | Vacancy Fulfilment of Trainers in Non-PM- SETU ITIs | Trainer vacancies filled / total vacancies identified in non-PM- SETU ITIs in the State x 100. | - | - | >= 70% | >= 75% | >= 80% |
| 2 | Percentage of trainers that have undergone trainings under Component II of PM- SETU | Trainers completing Component II / trainers with >3 years experience as on 31 March of preceding FY x 100. | - | >= 50% | >= 60% | >= 70% | >= 80% |