Diagrams Gallery
Every flowchart, user journey map, wireframe and BPMN diagram extracted from the five source Detailed Project Reports, grouped by document. Tap any diagram to view it full-size.
Learning and Operations Management System (LOMS) (34 diagrams)
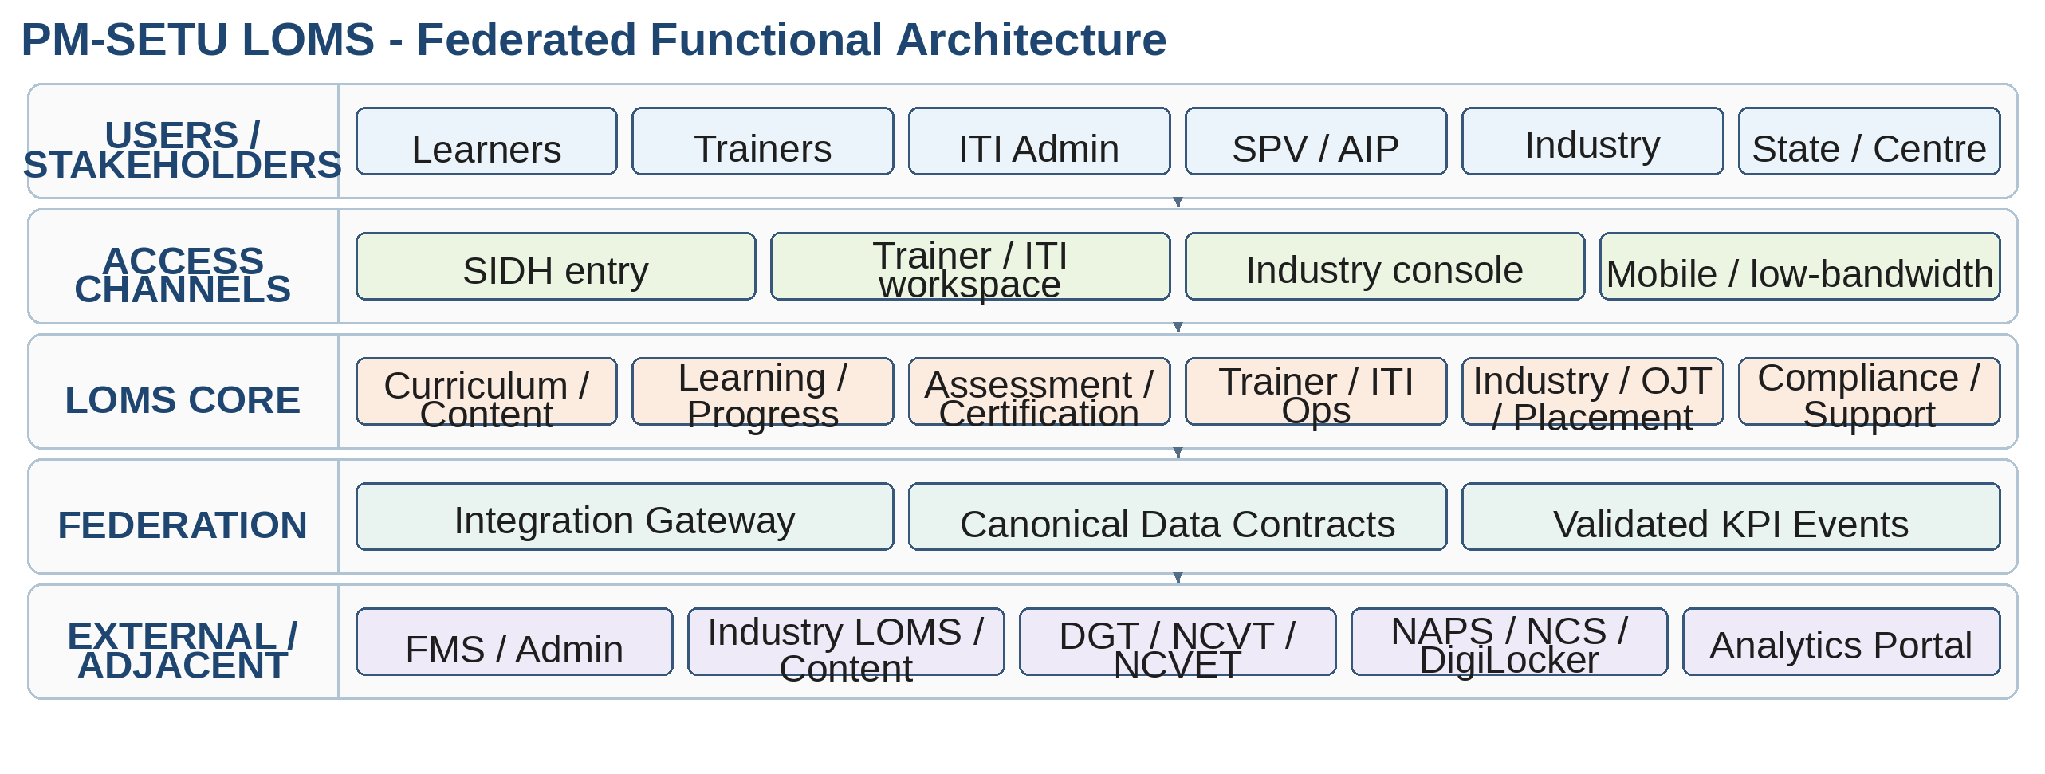
Design Principles
Figure 1 - PM-SETU LOMS federated functional architecture (logical view).
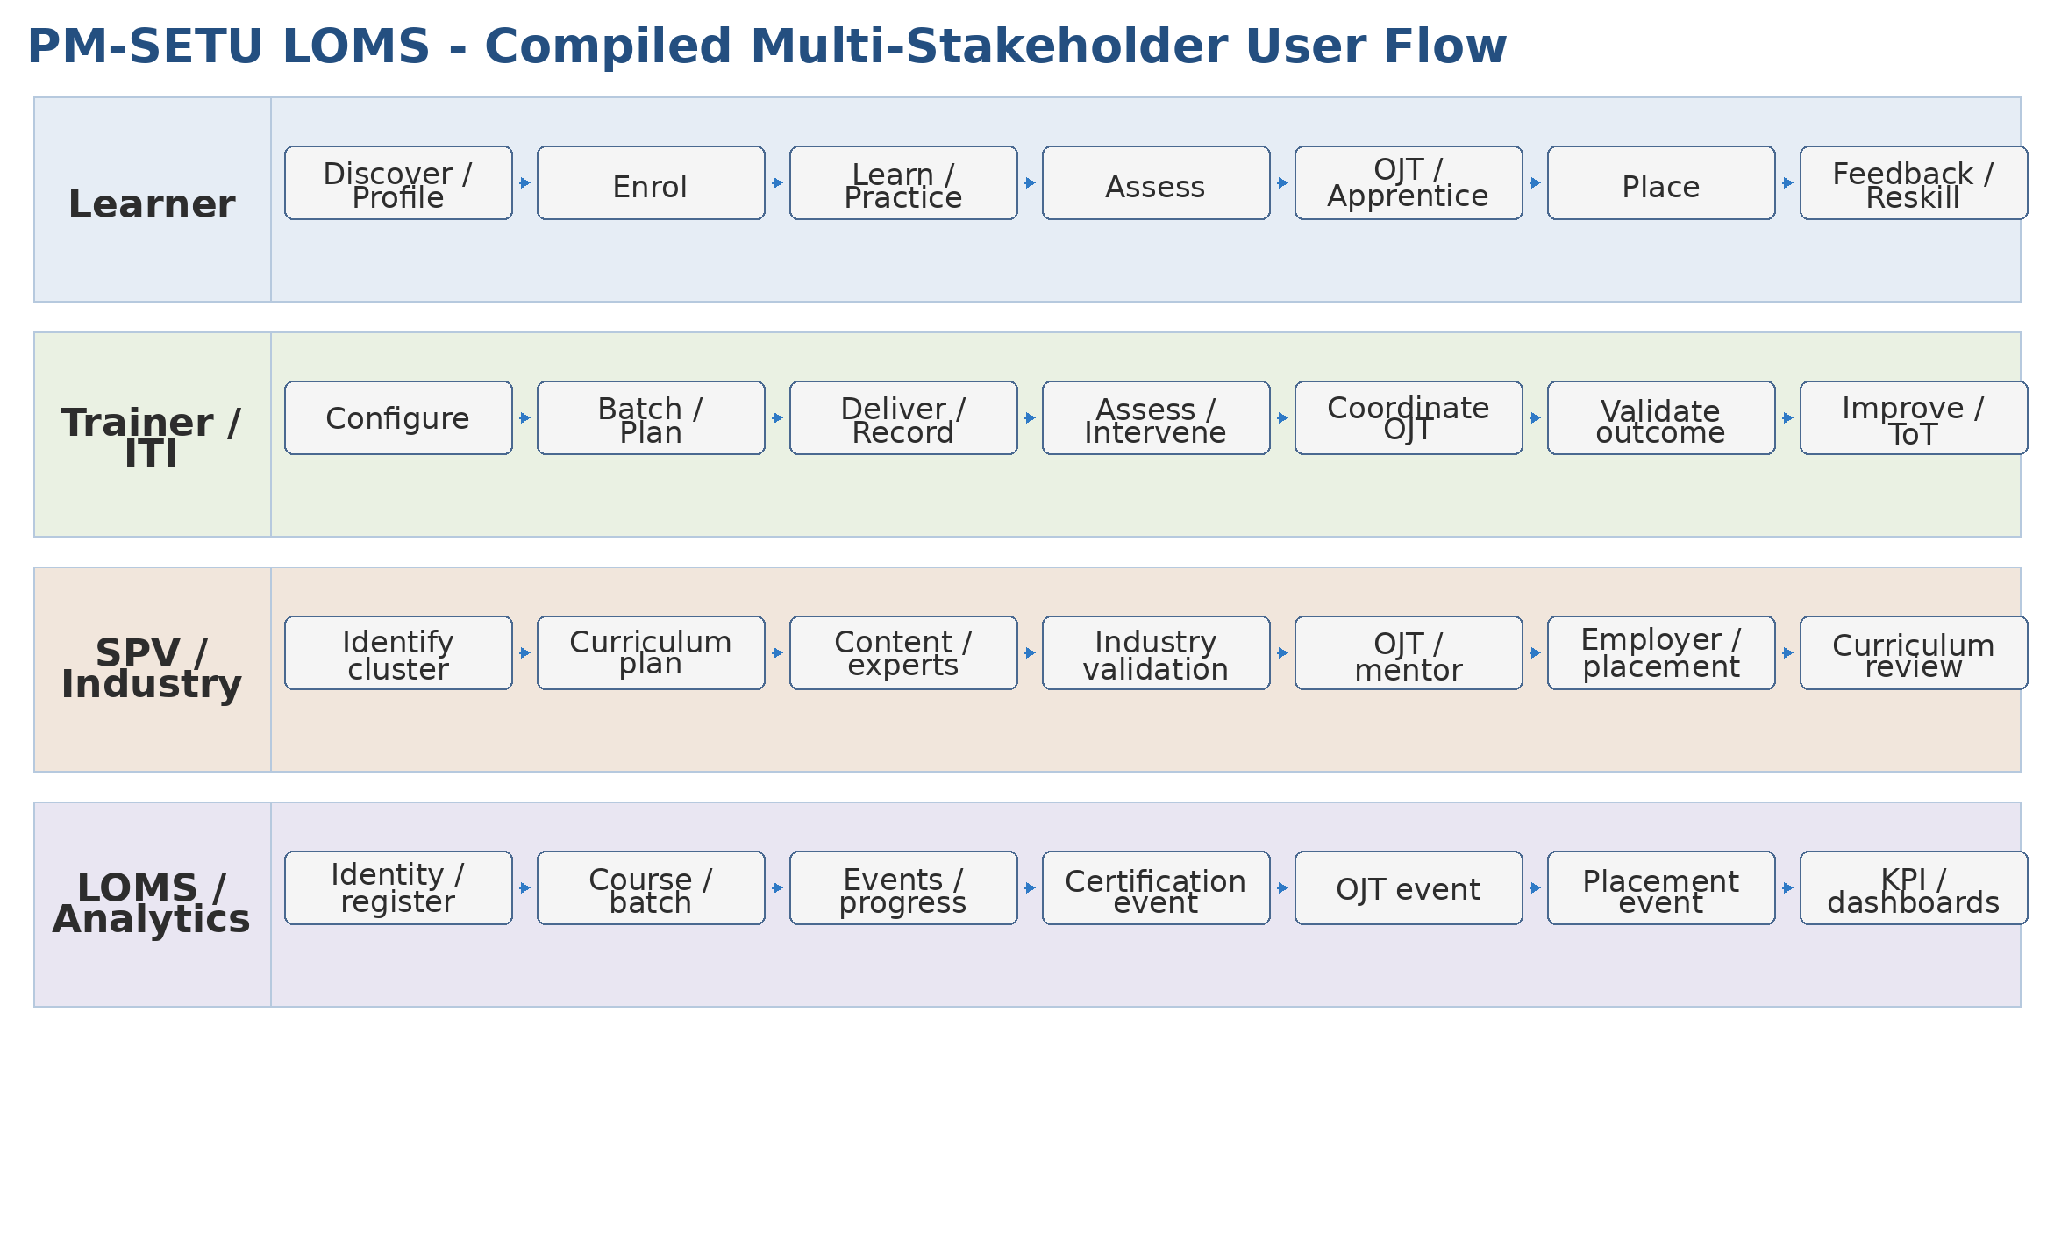
2. Business Requirements and User Journeys
Figure 2 - Compiled multi-stakeholder PM-SETU LOMS user flow.

2.4 ITI Administrator Journey
No caption in source

2.5 SPV / AIP Journey
No caption in source

2.6 Industry Partner with Existing LOMS
No caption in source

2.7 Content-Only / Knowledge Partner Journey
No caption in source
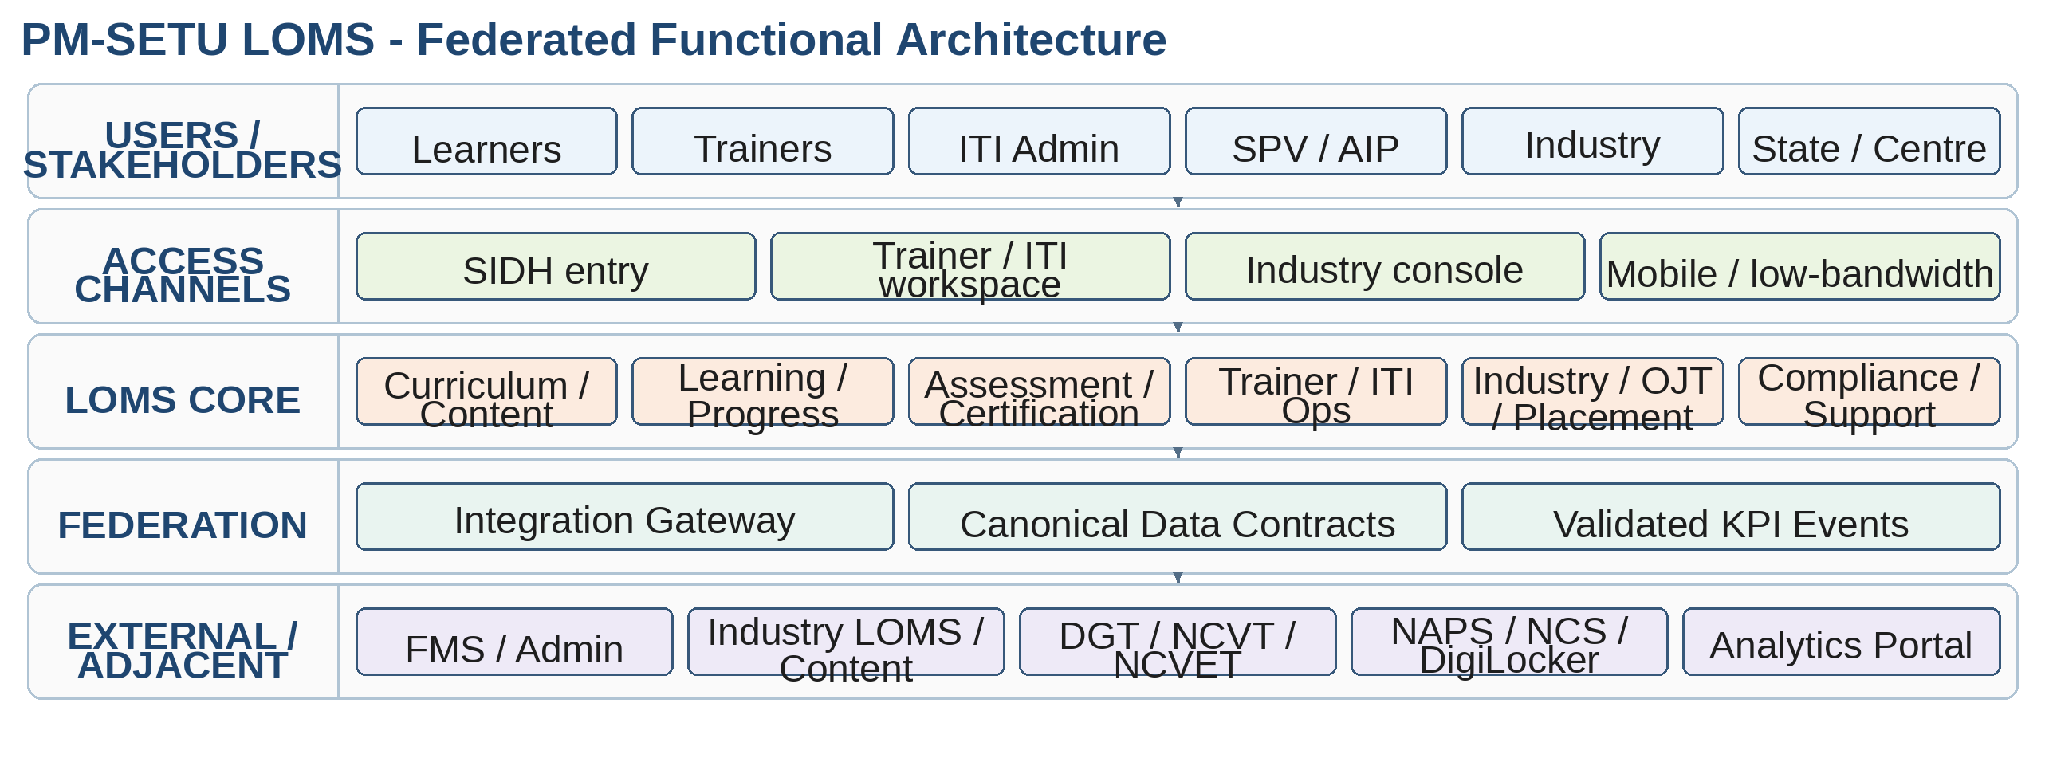
4. Solution Architecture
Figure 3 - Compiled PM-SETU LOMS federated functional architecture.
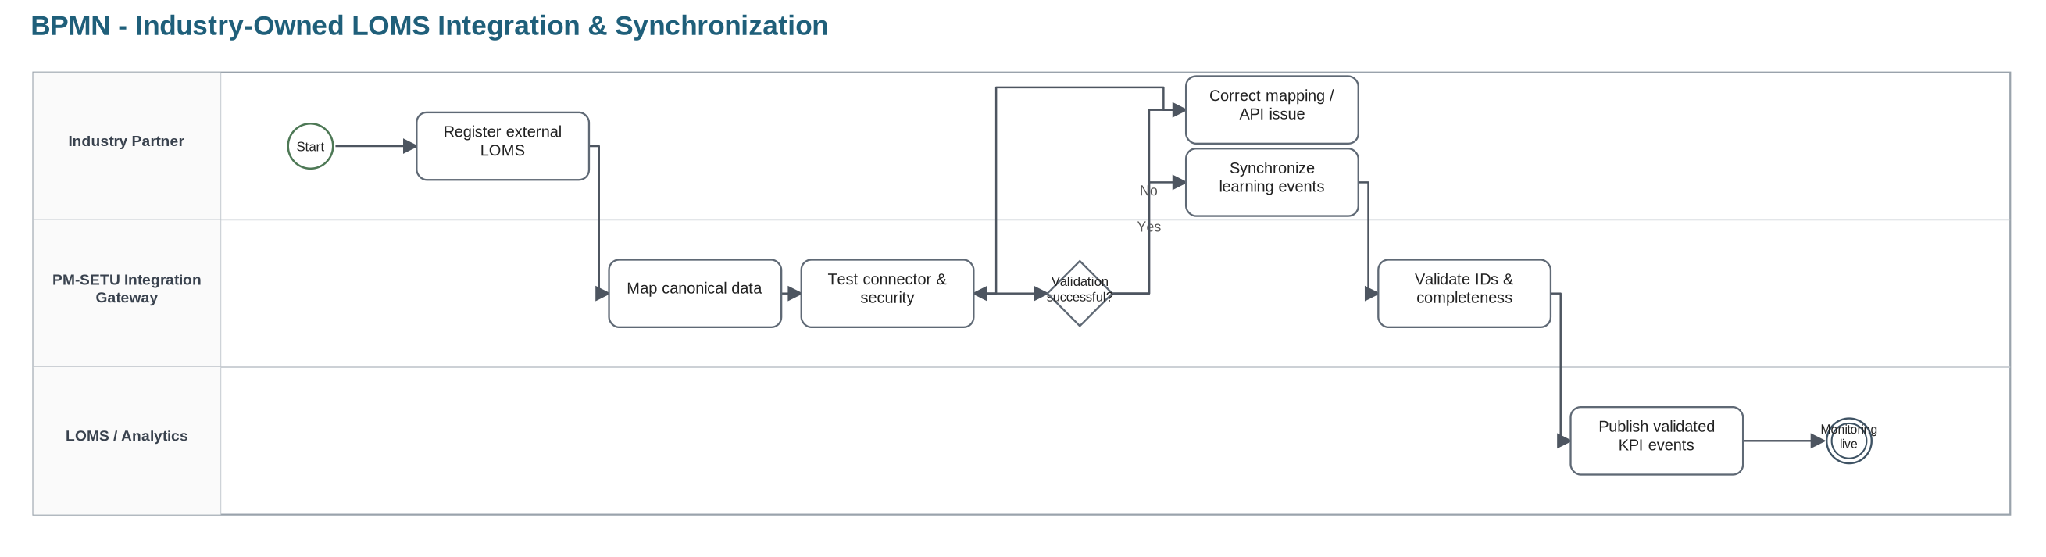
4.3 Federation & Integration Layer
Figure 4 - Connected LOMS integration process.
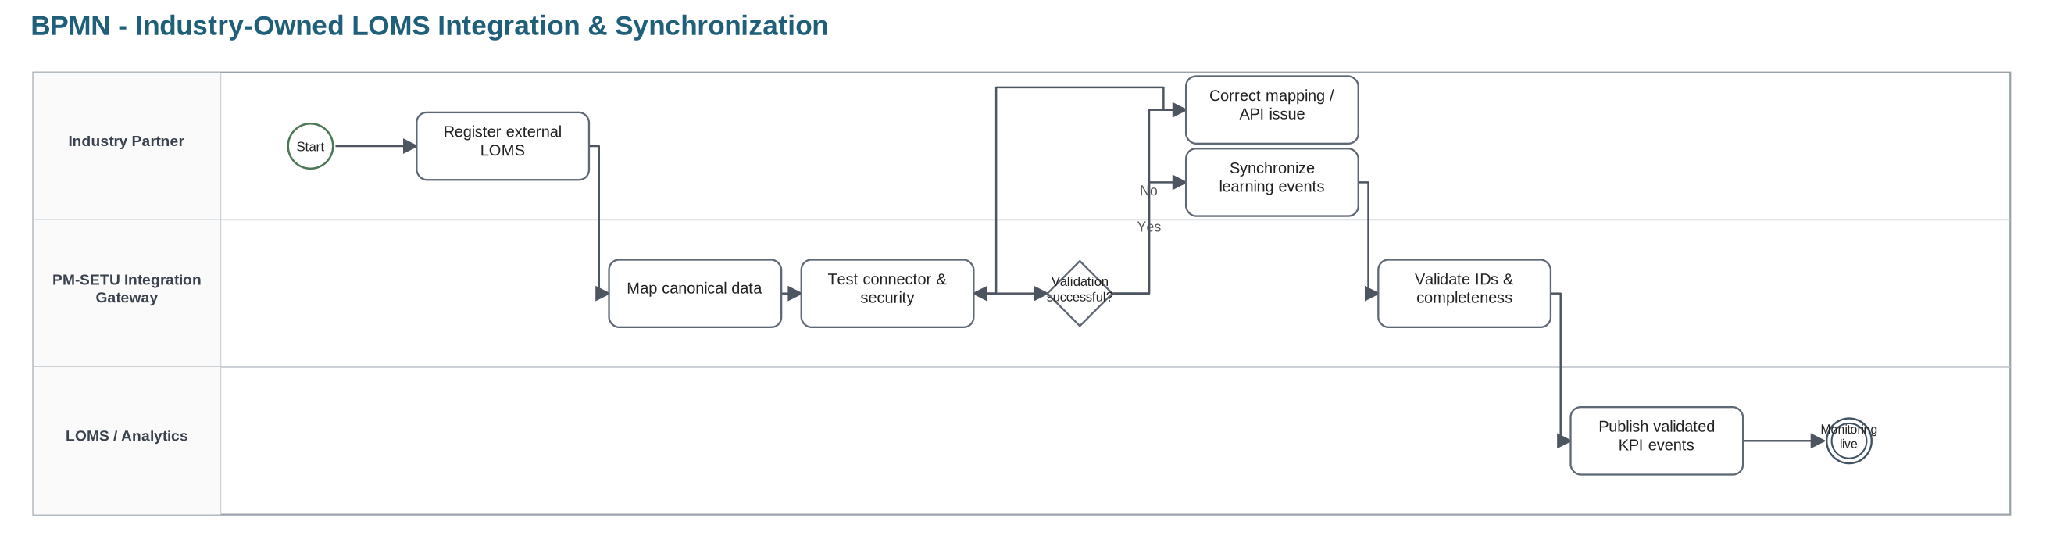
7.1.1 Industry-owned LOMS integration
No caption in source
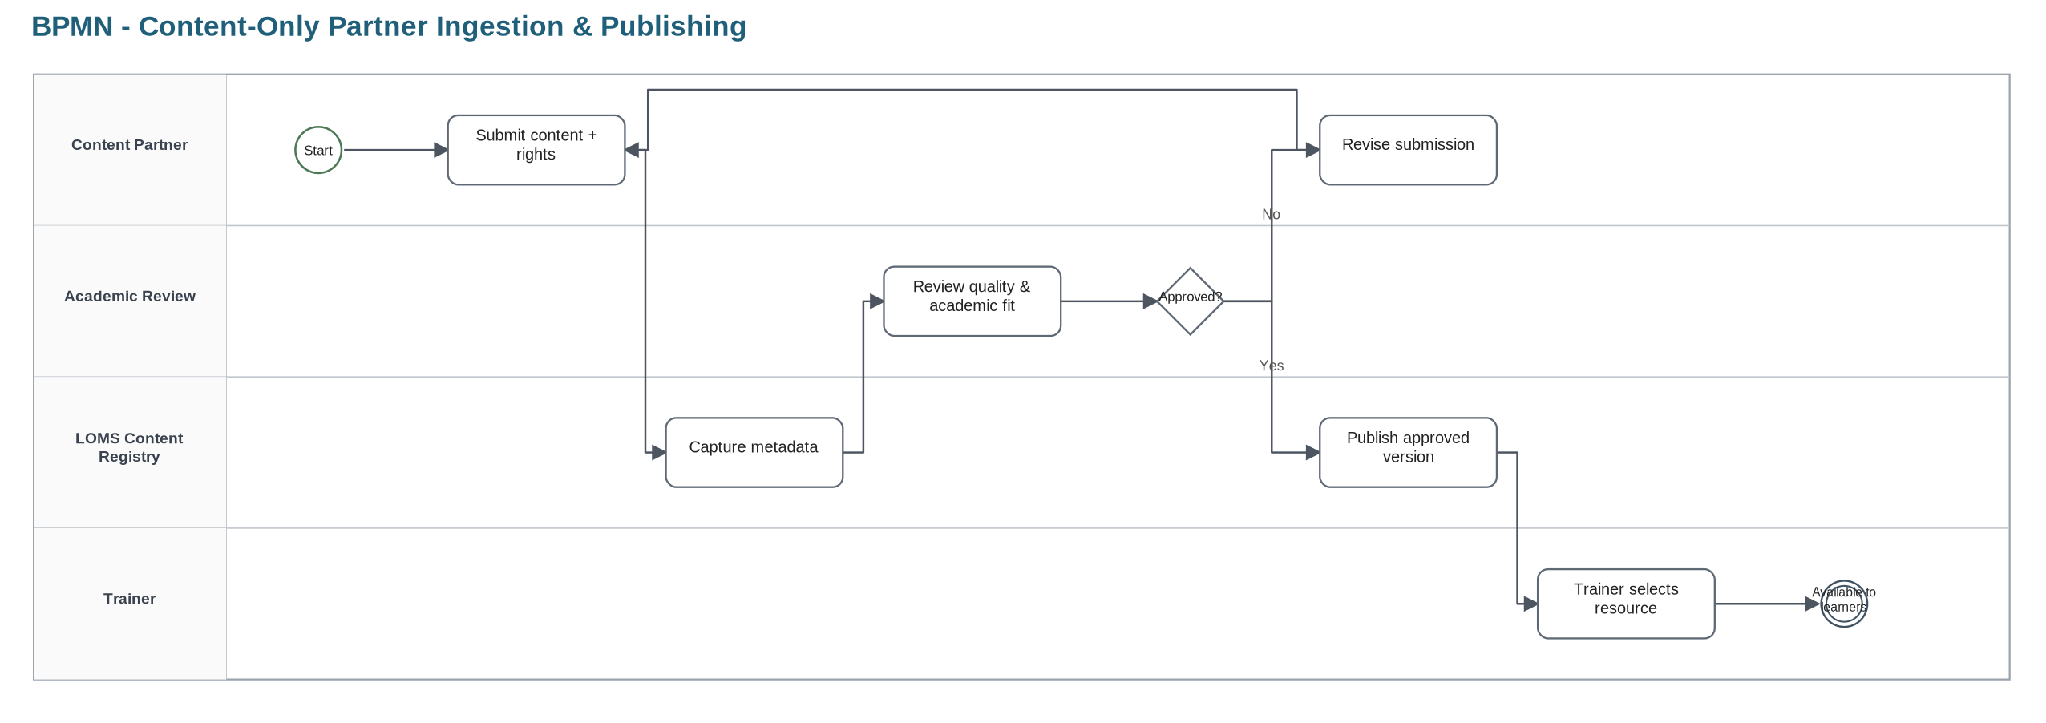
7.1.2 Content-only partner ingestion
No caption in source
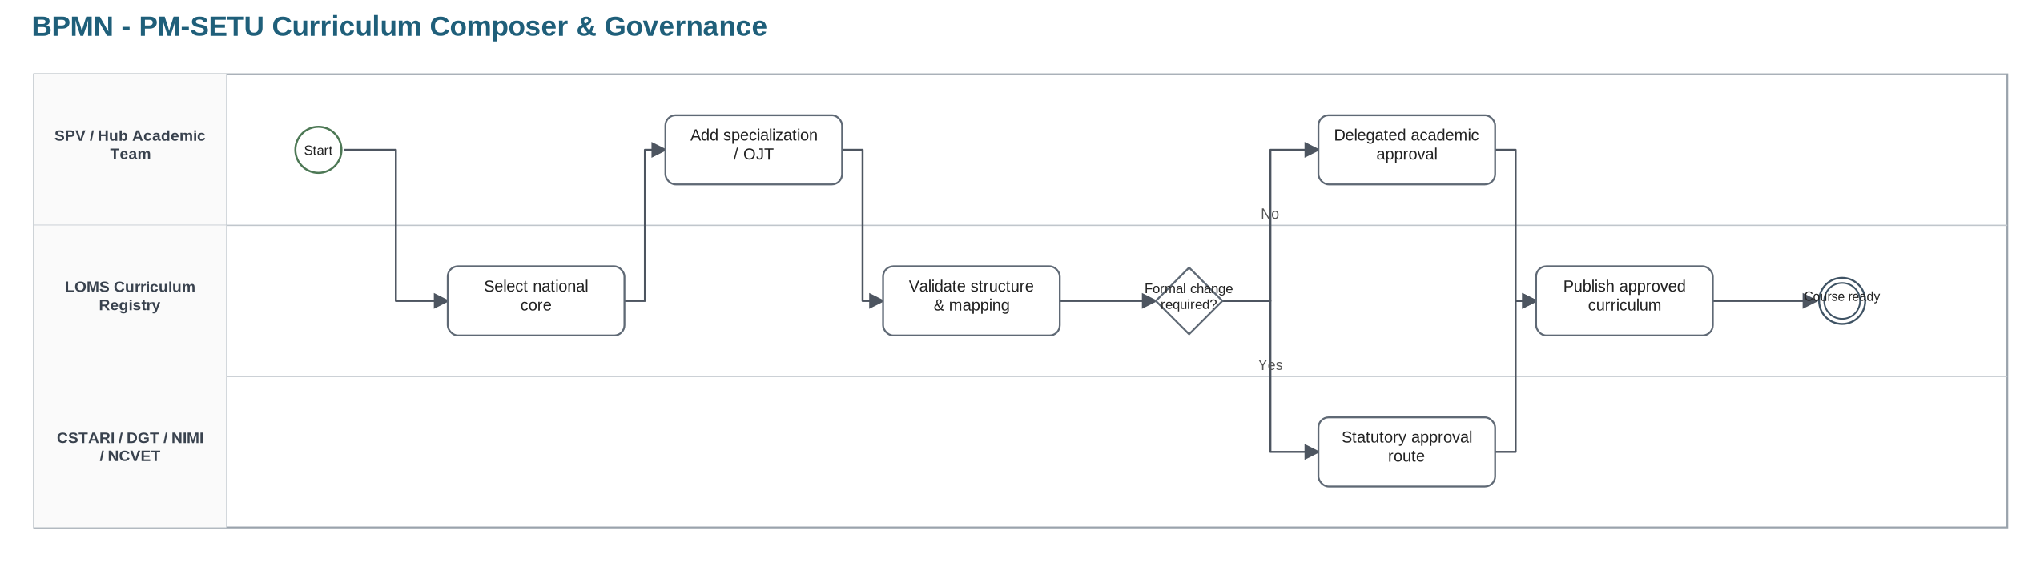
7.1.3 Curriculum Composer and approval
No caption in source
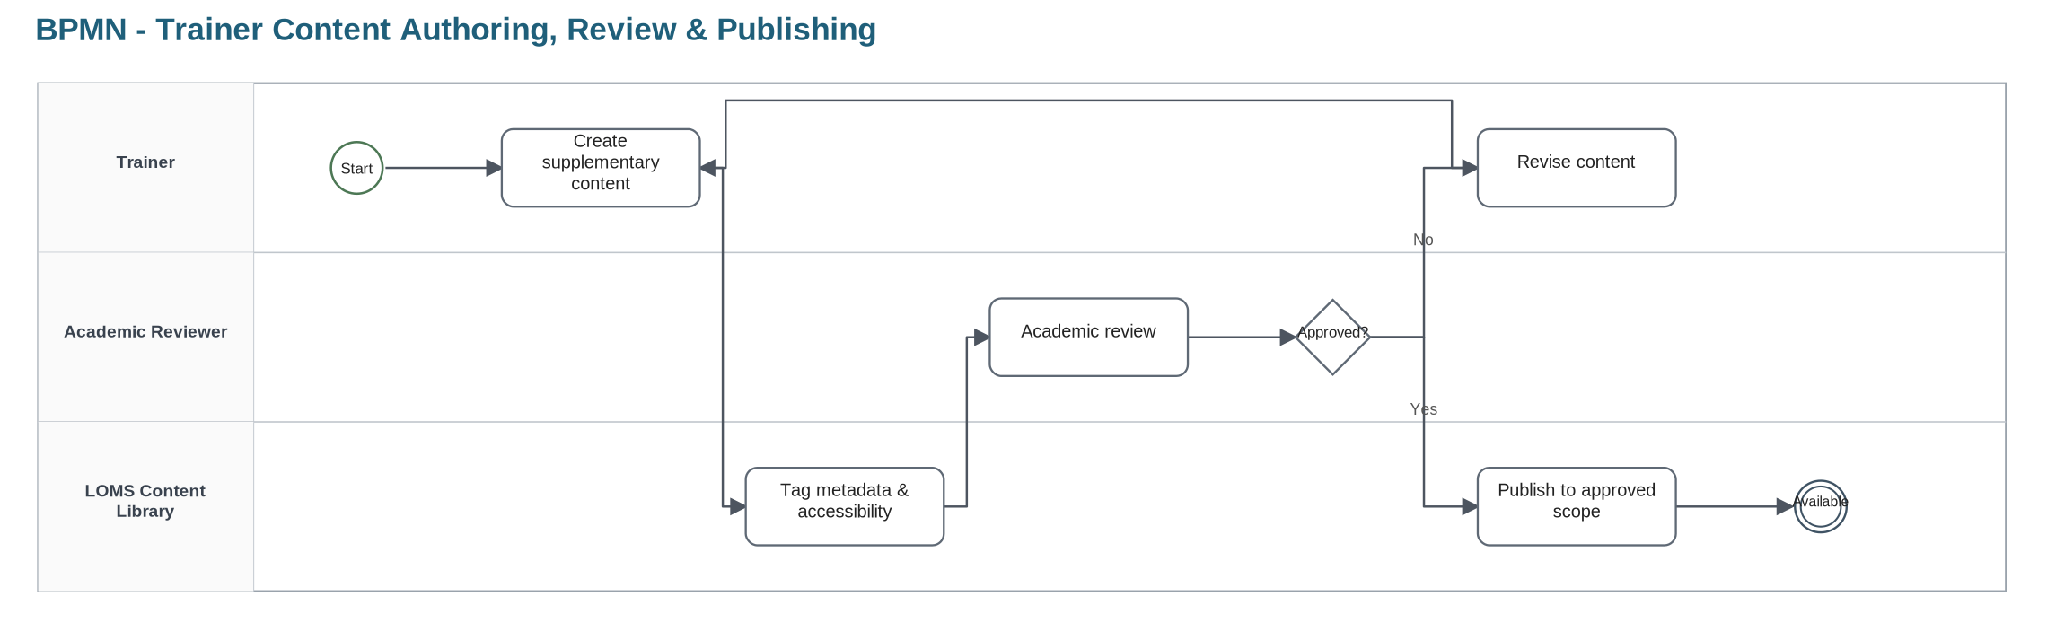
7.1.4 Trainer content authoring and publish
No caption in source
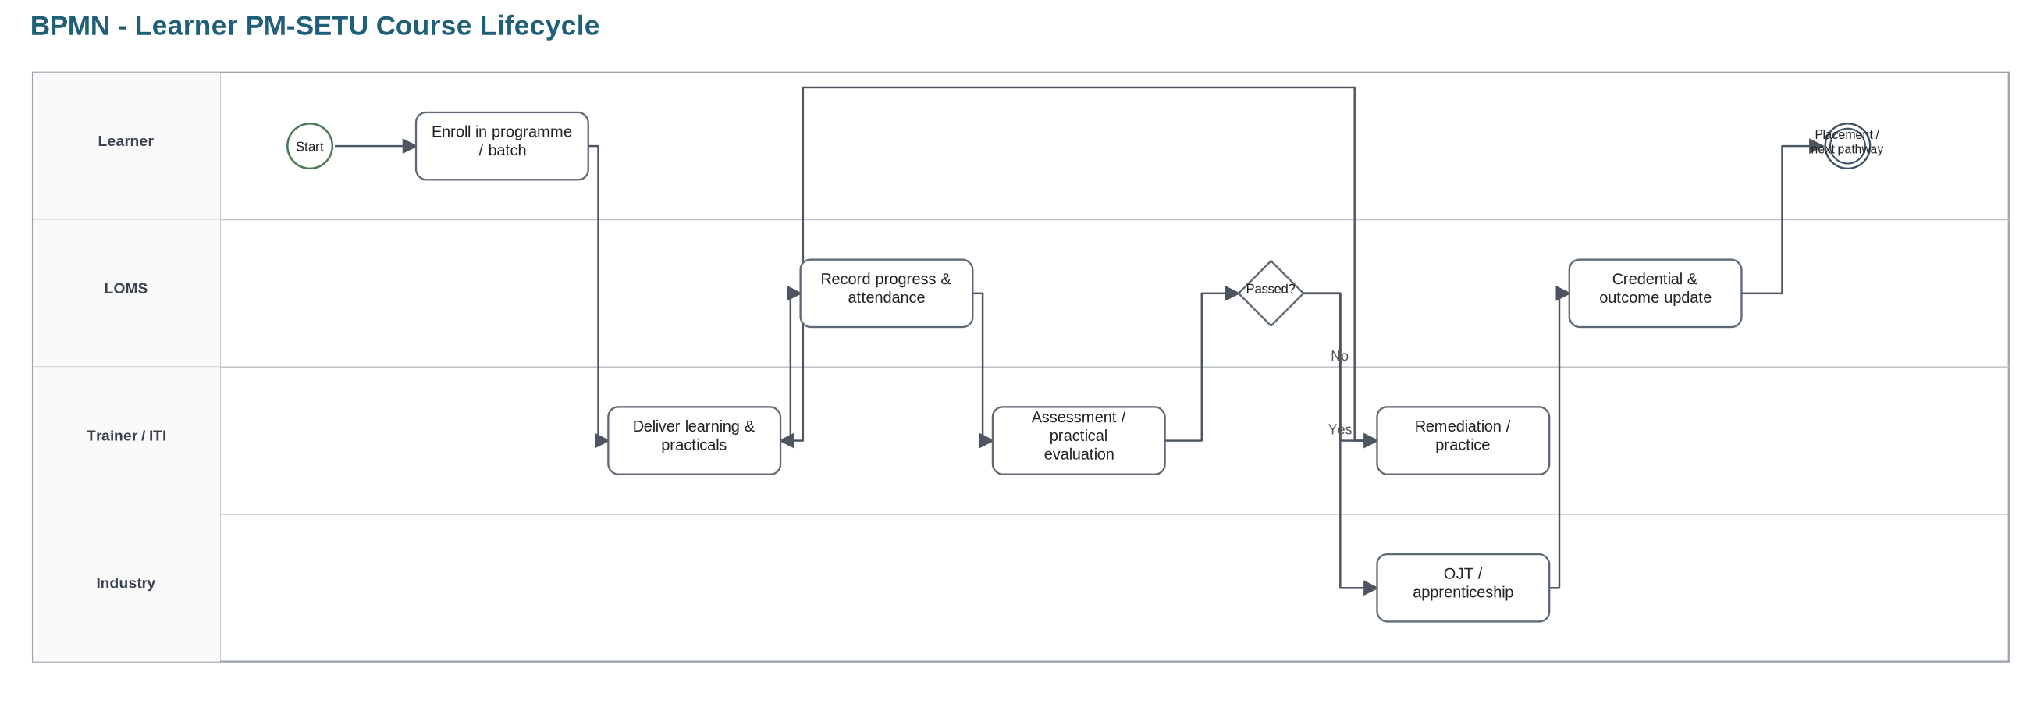
7.1.5 Learner course lifecycle
No caption in source
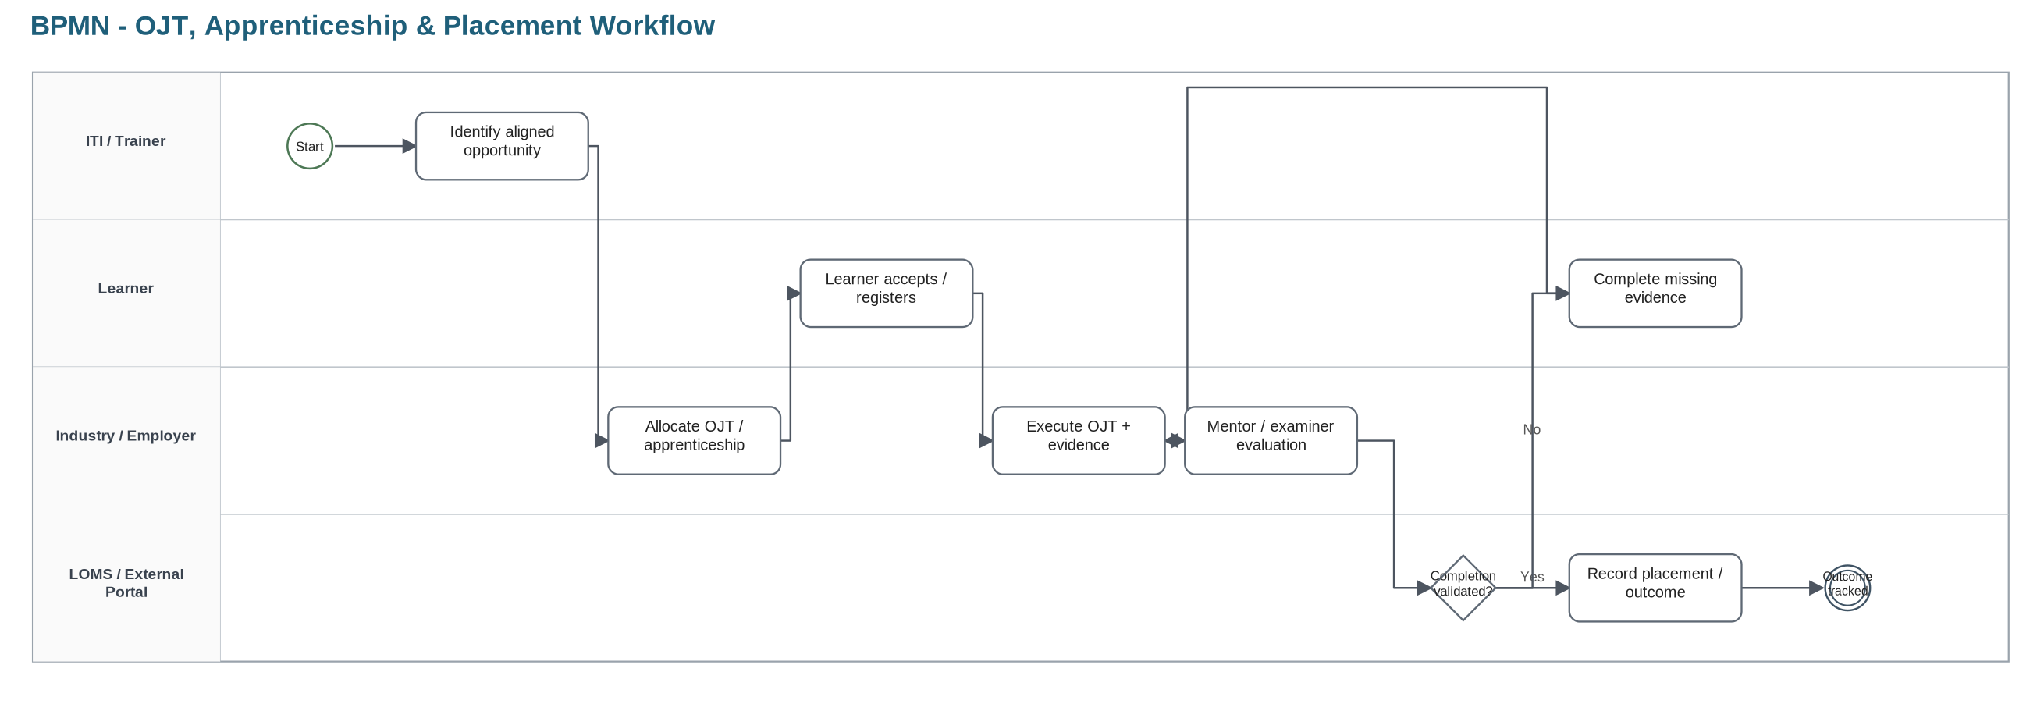
7.1.6 OJT / apprenticeship / placement
No caption in source
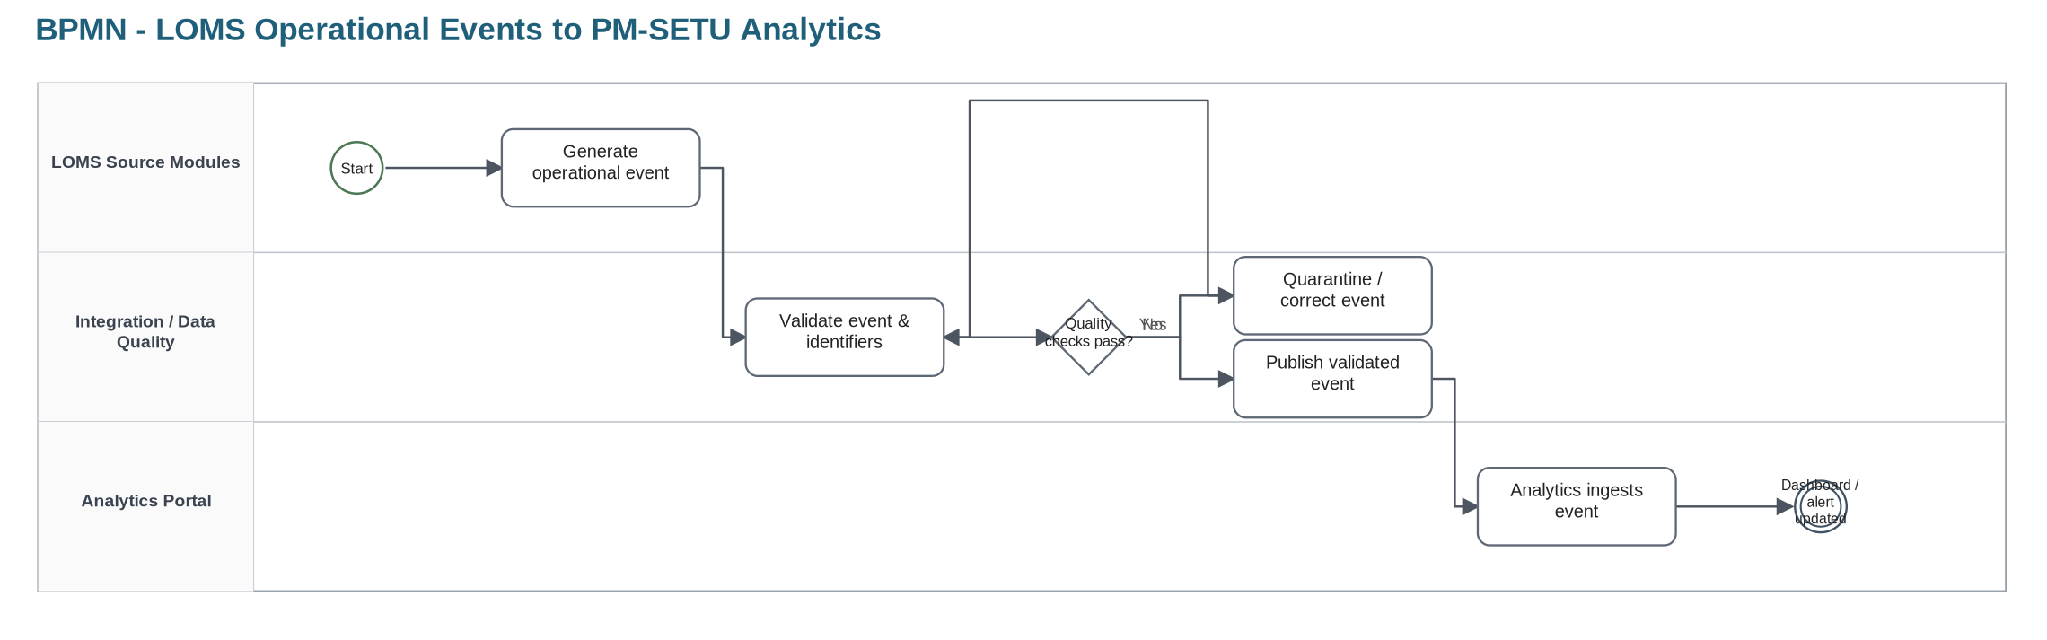
7.1.7 KPI event pipeline
No caption in source
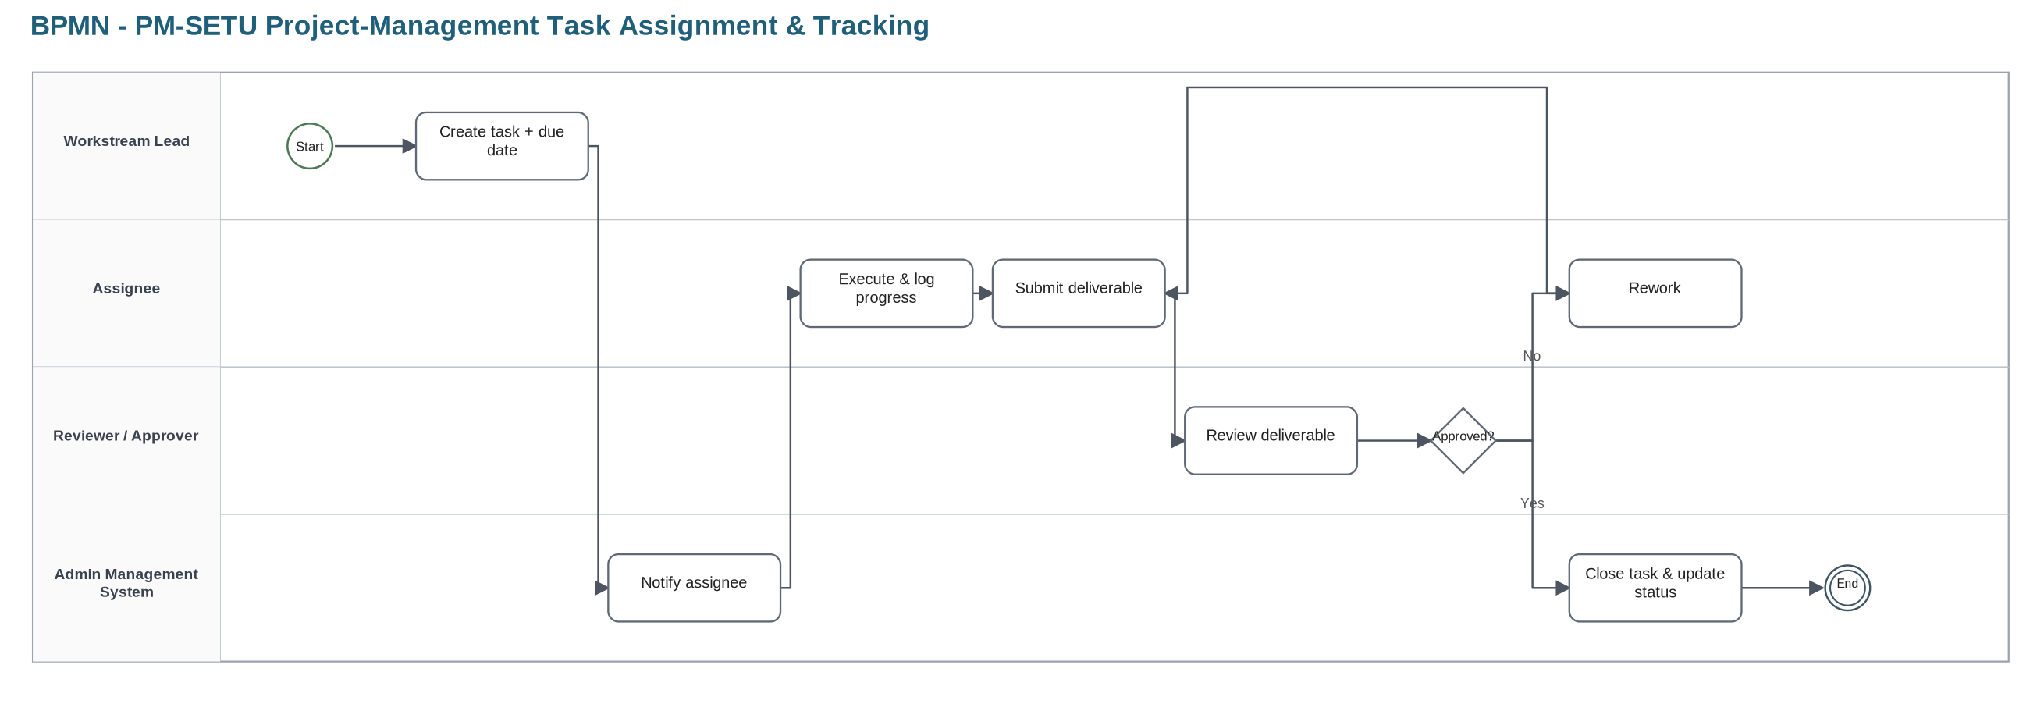
7.2.1 PM-SETU project-management task workflow
No caption in source
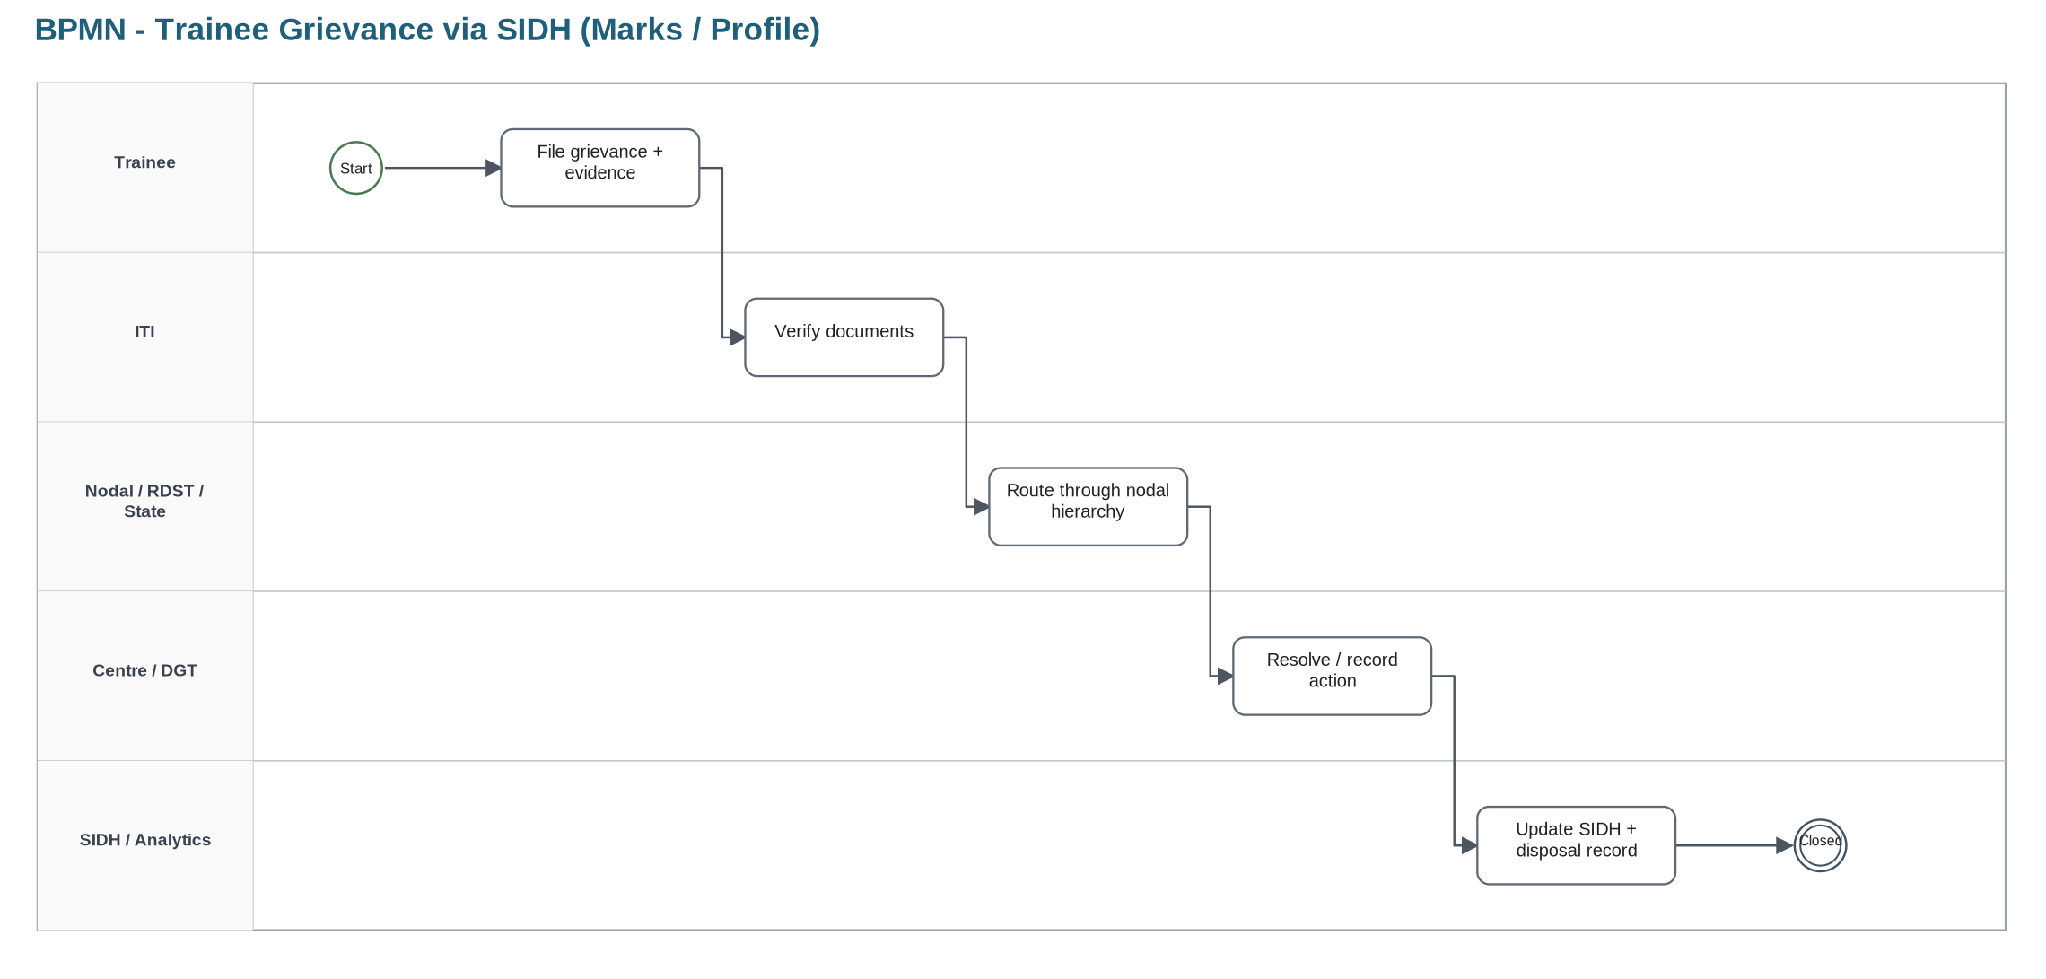
7.2.2 Trainee grievance via SIDH - marks/profile
No caption in source
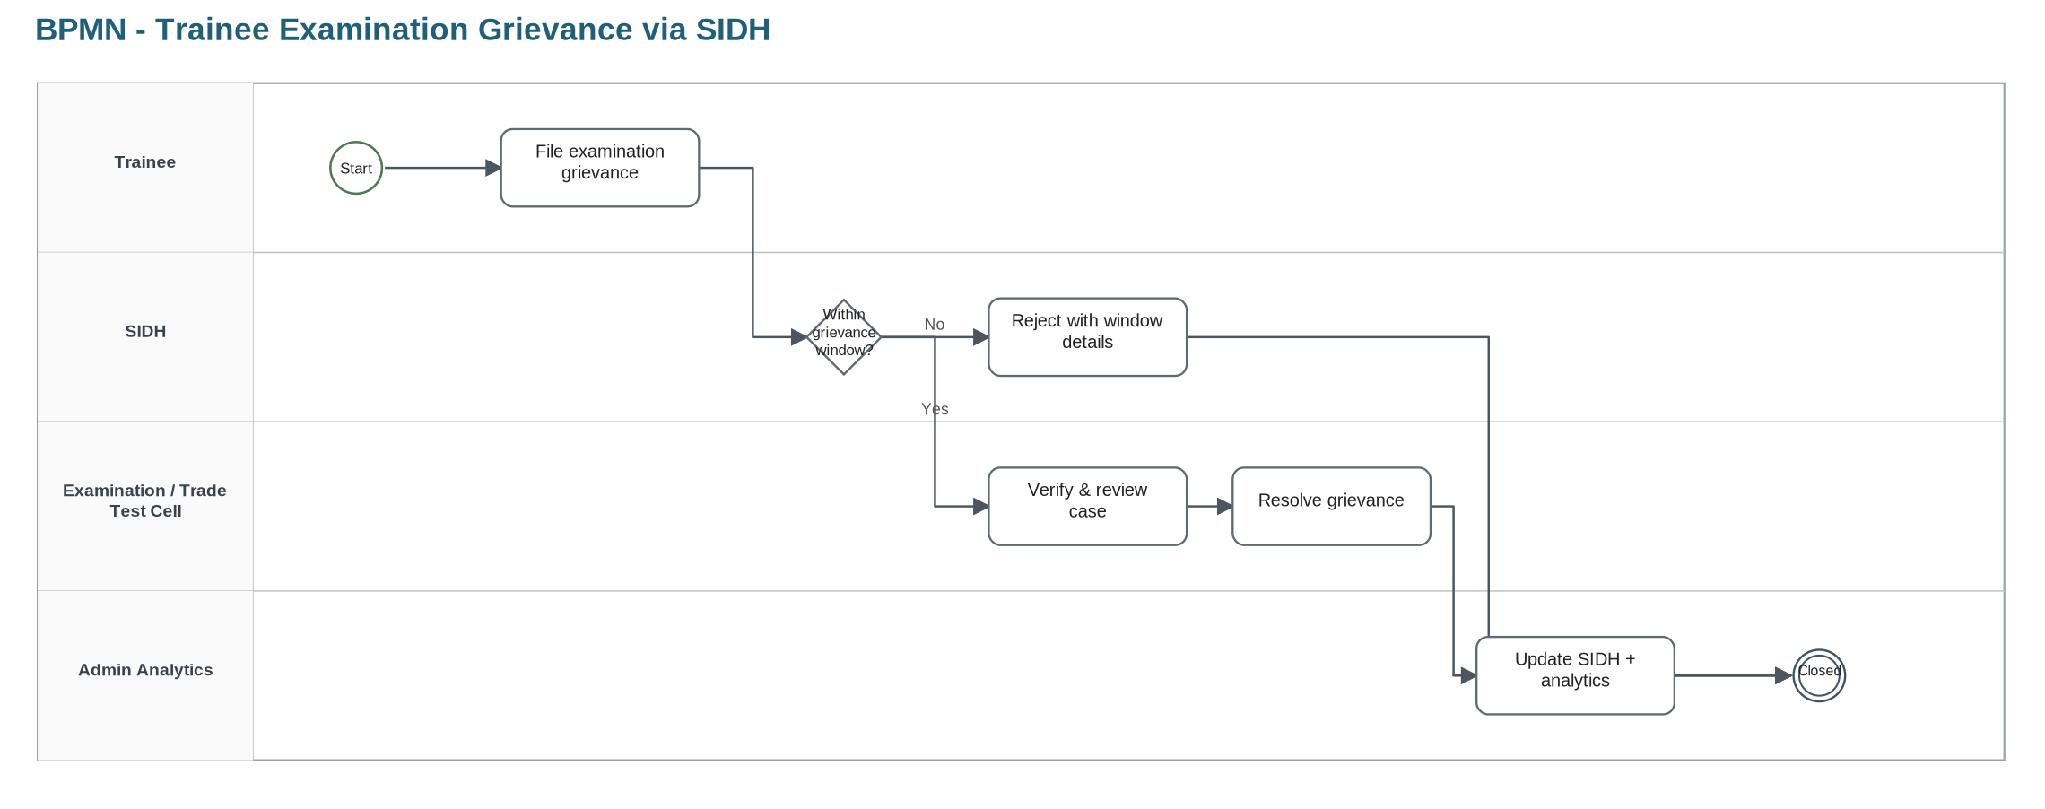
7.2.3 Trainee examination grievance via SIDH
No caption in source
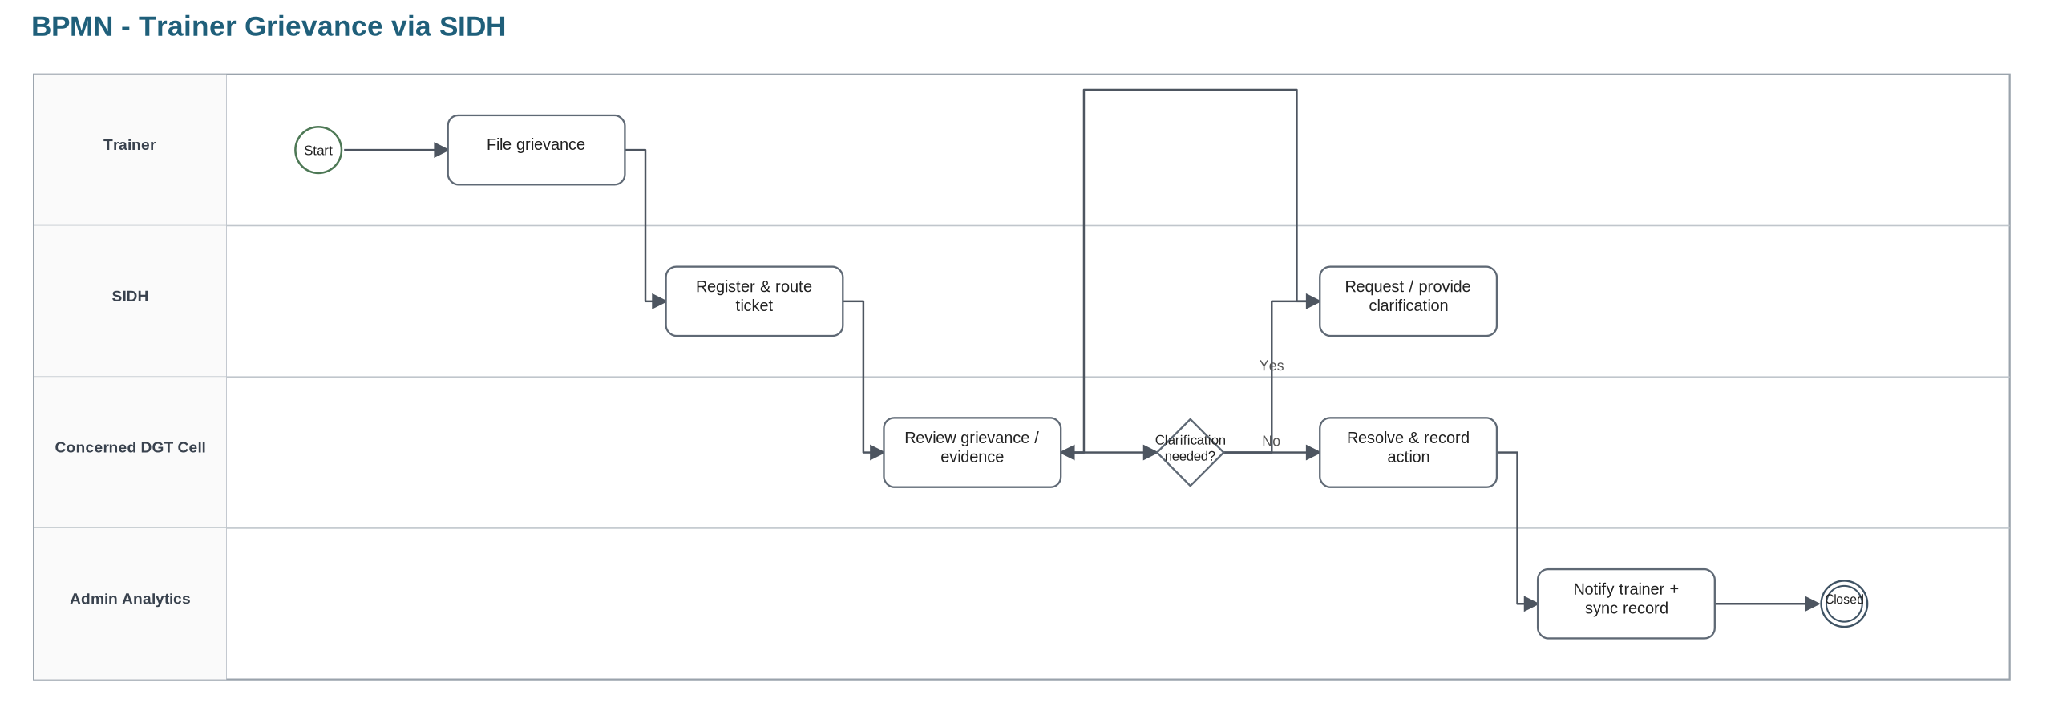
7.2.4 Trainer grievance via SIDH
No caption in source
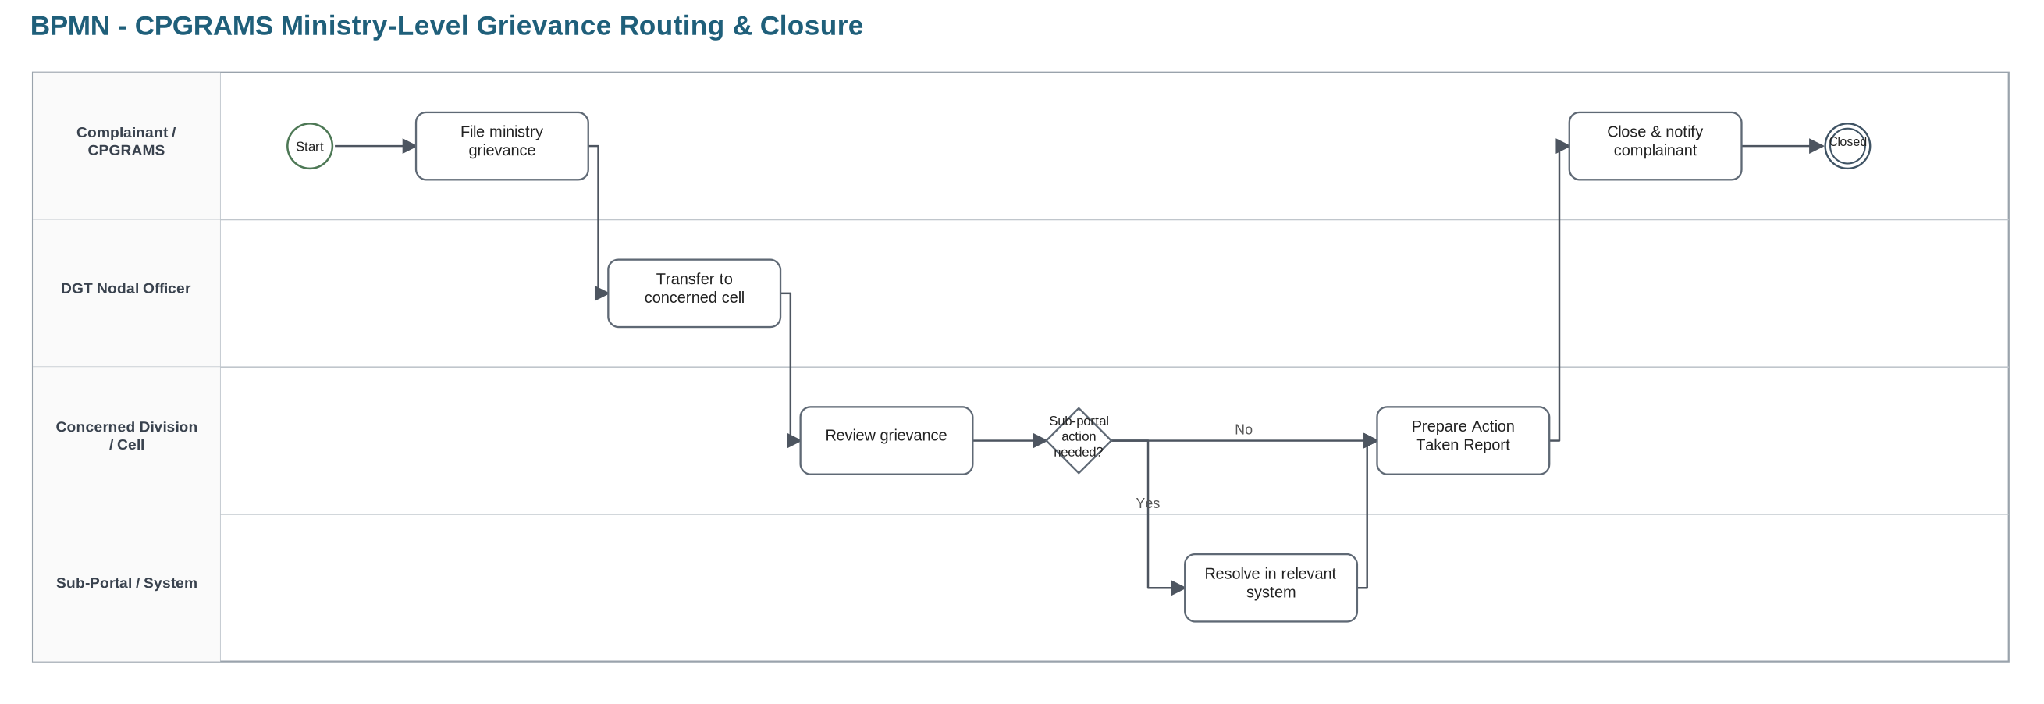
7.2.5 CPGRAMS grievance routing
No caption in source
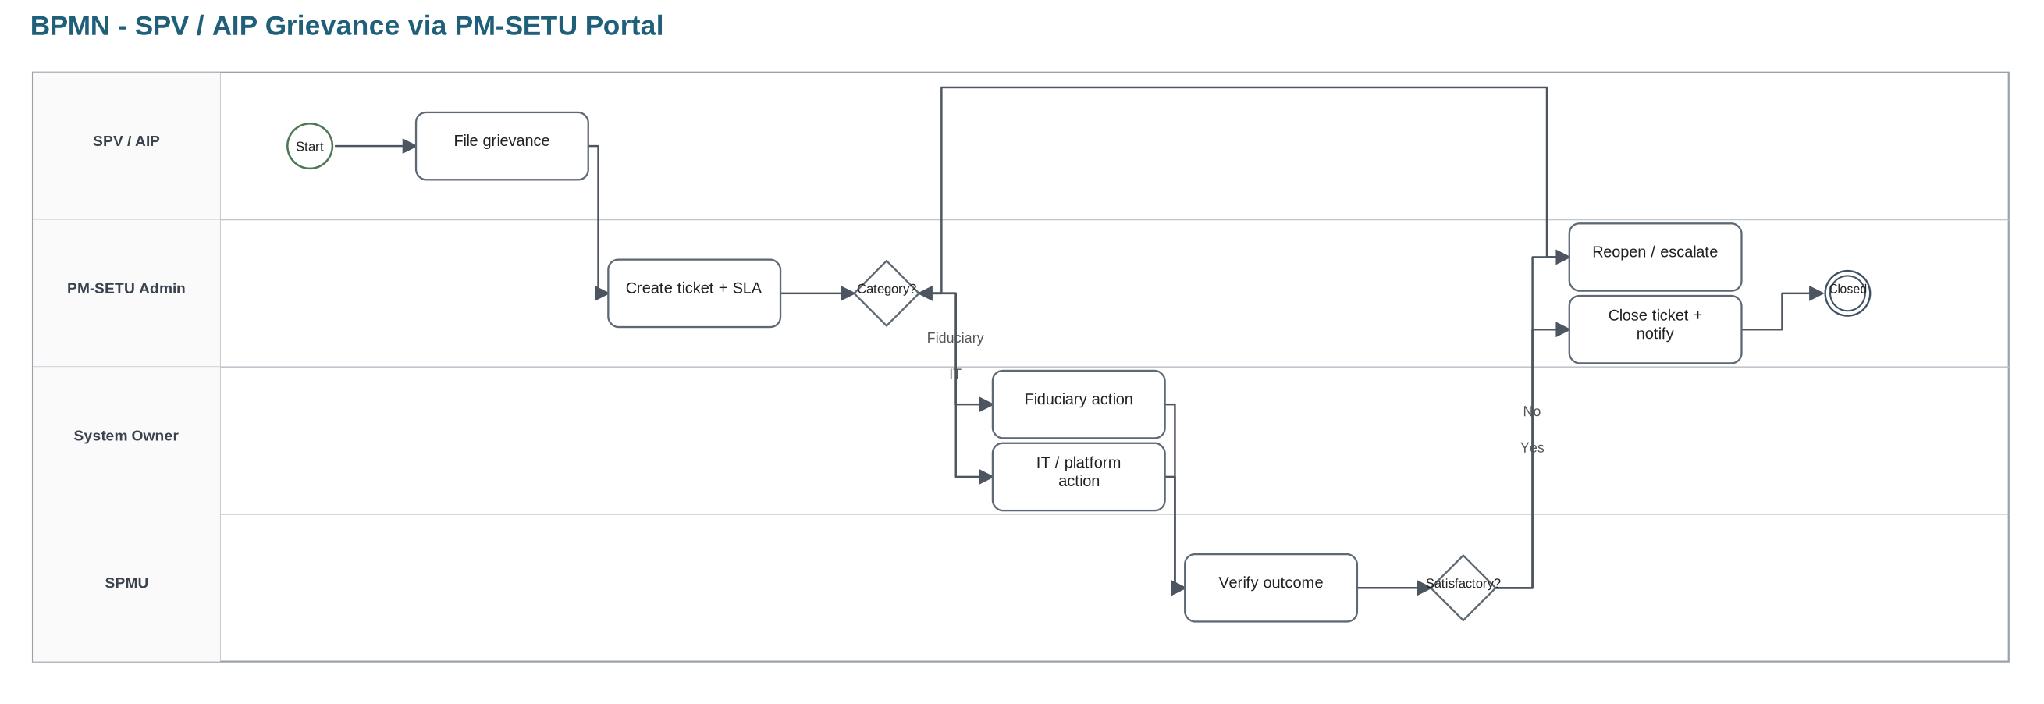
7.2.6 SPV/AIP grievance via PM-SETU portal
No caption in source
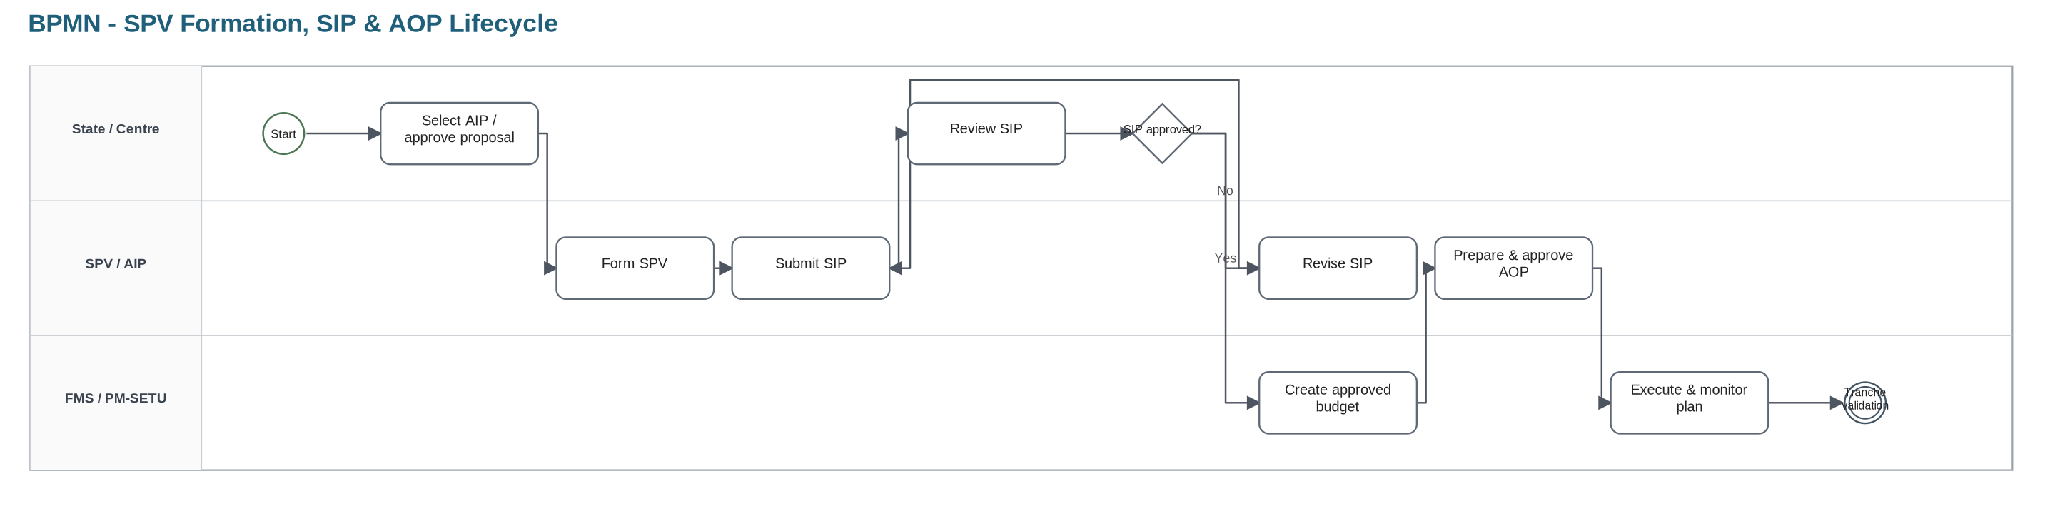
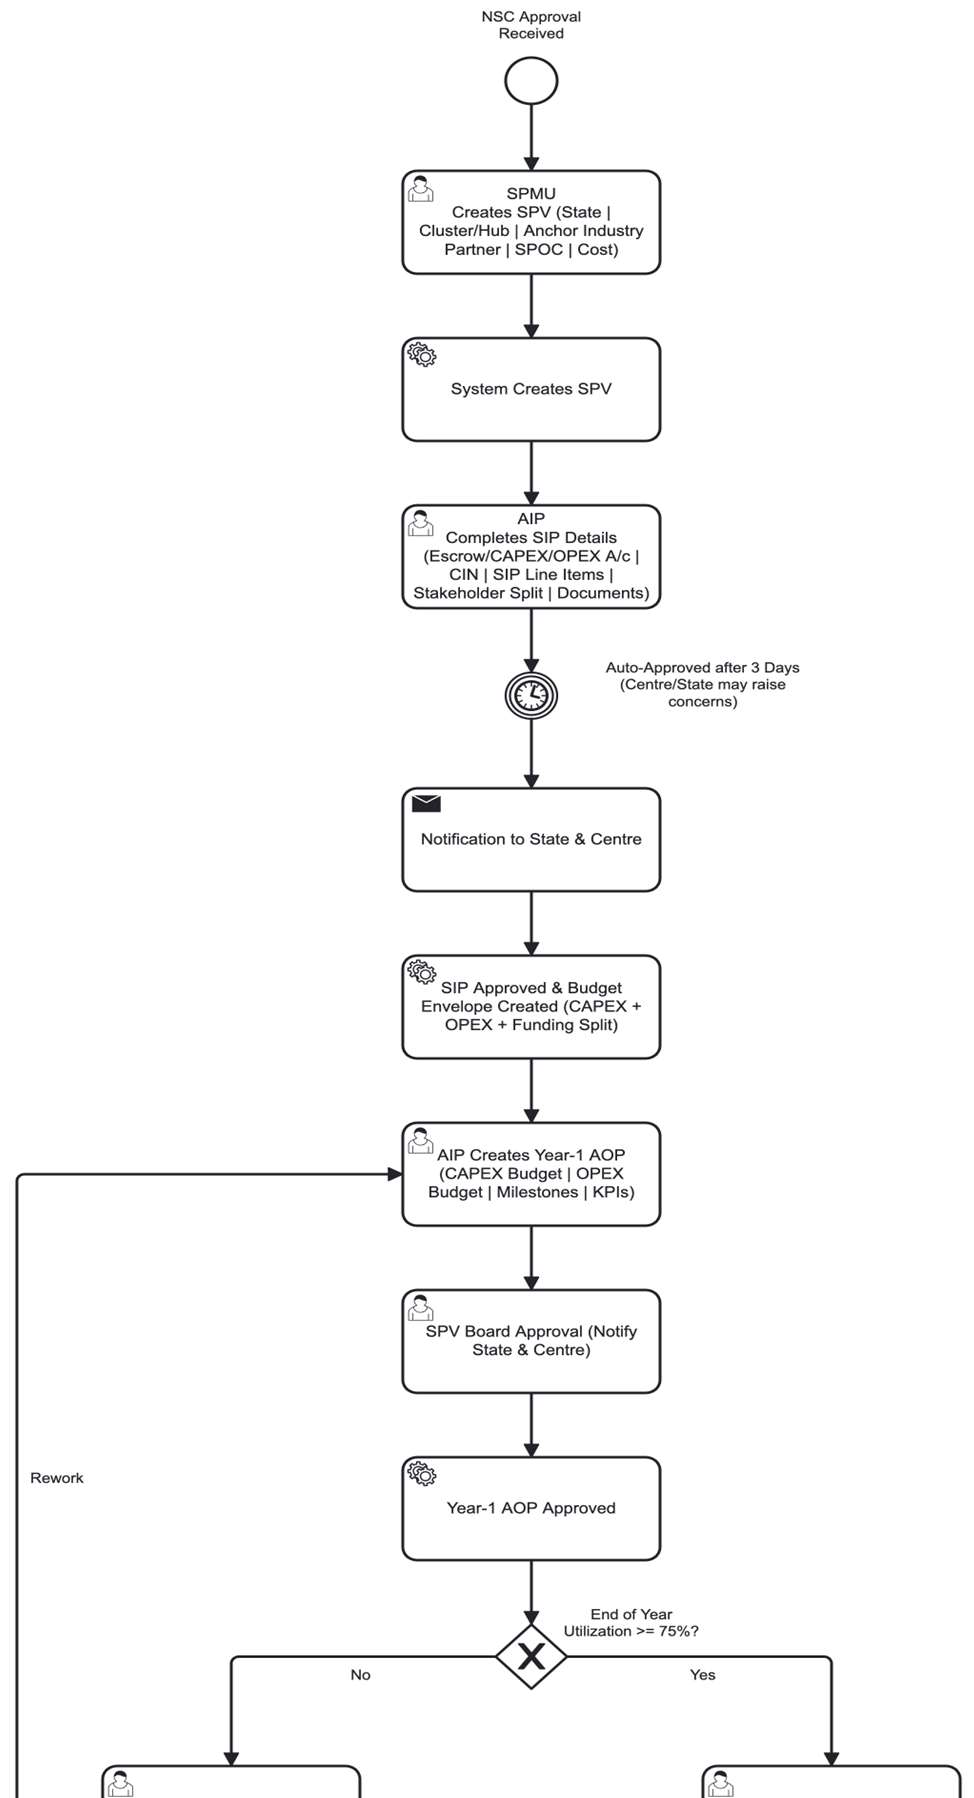
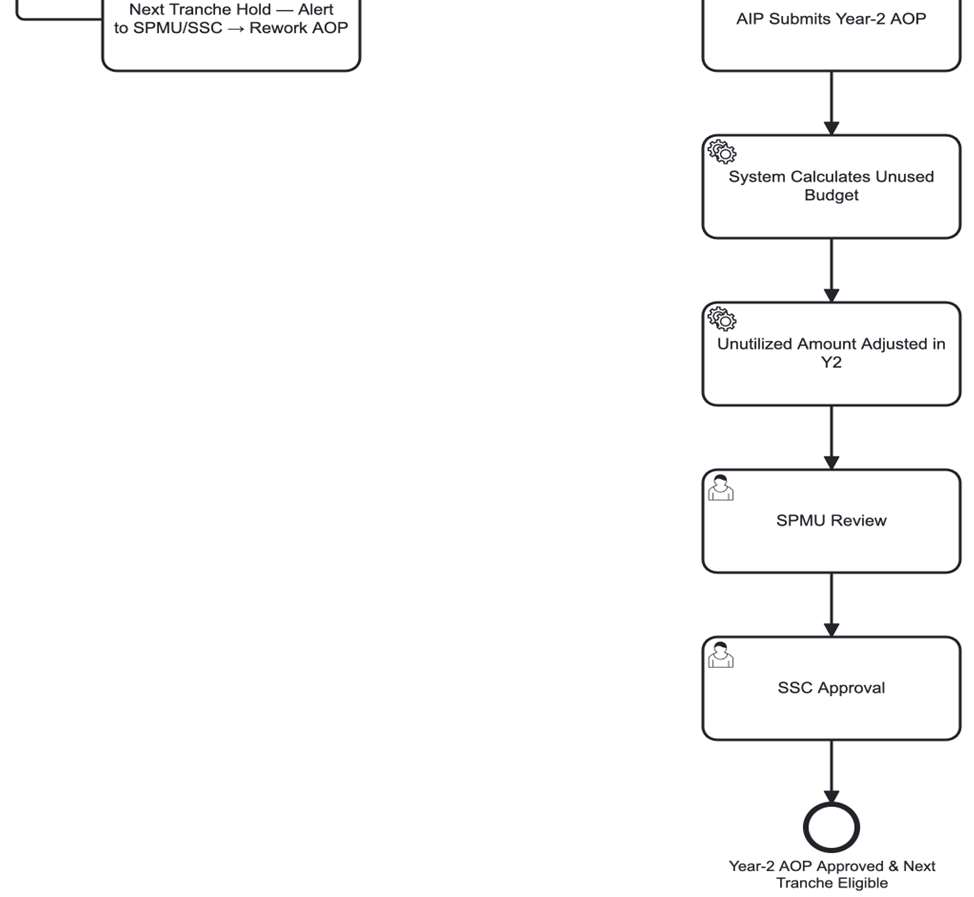
7.2.7 SPV formation / SIP / AOP lifecycle
No caption in source
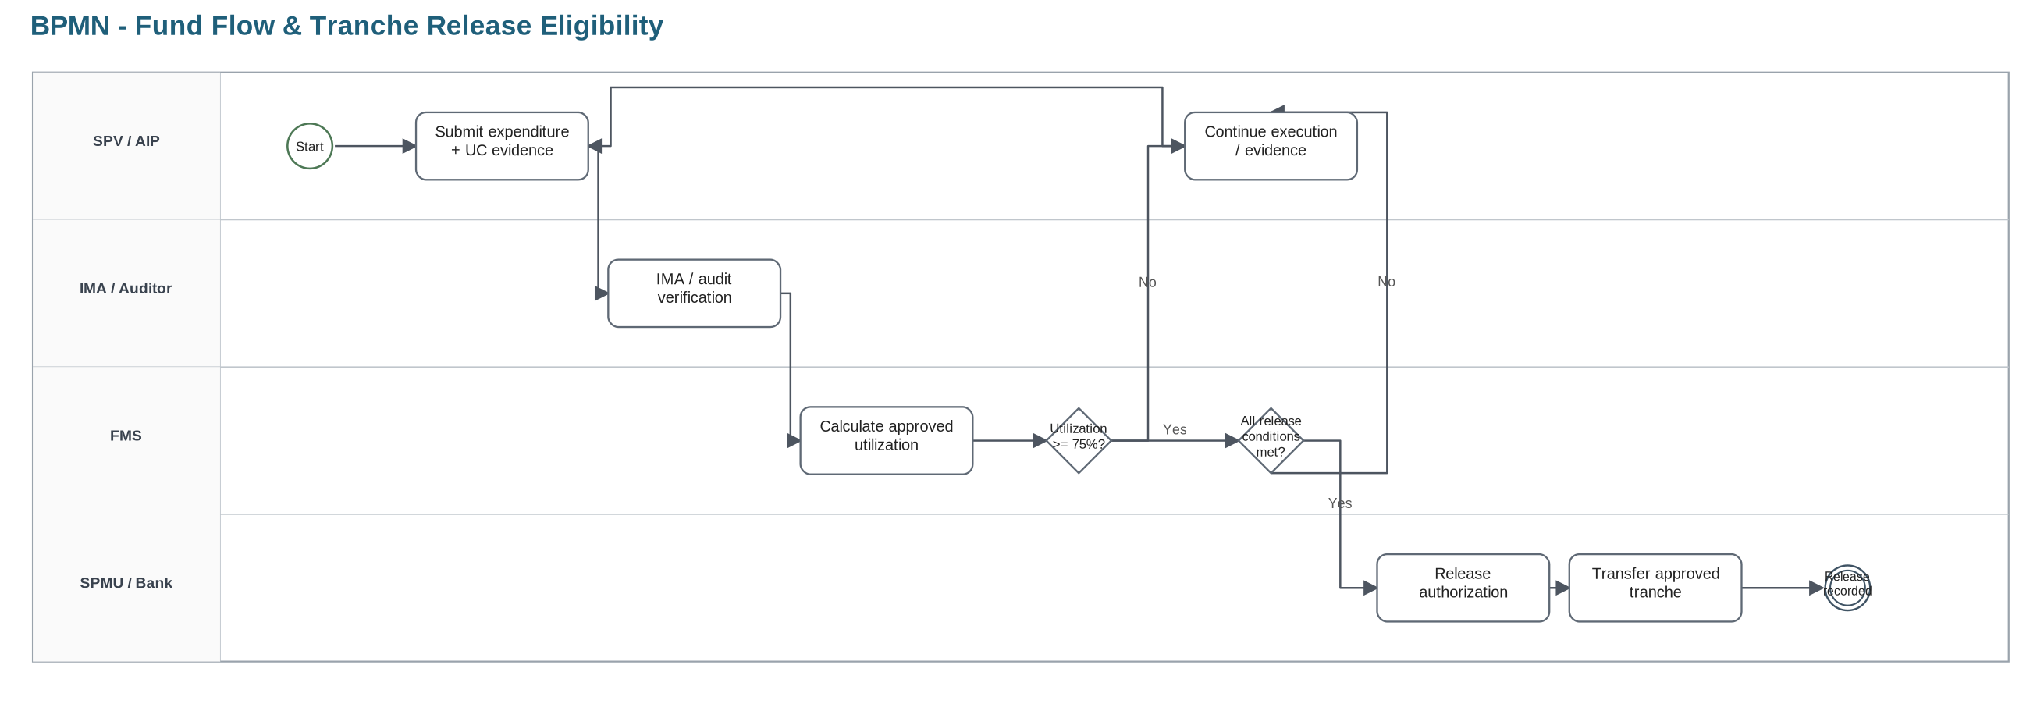
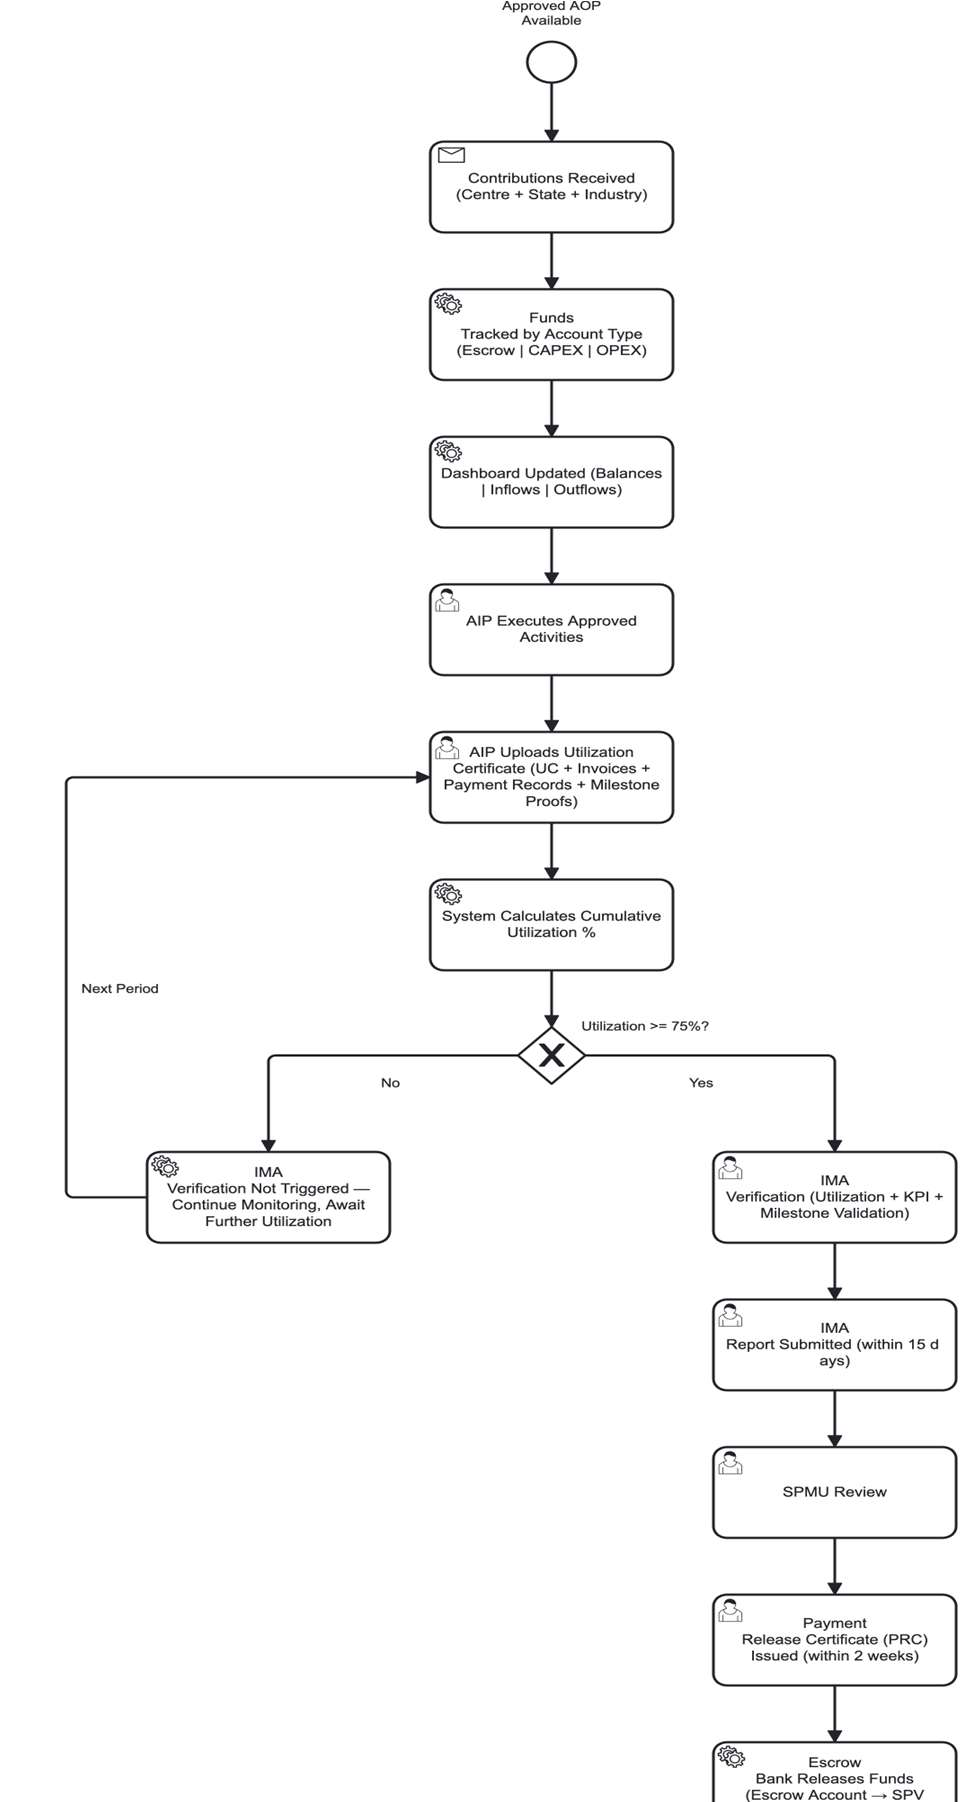
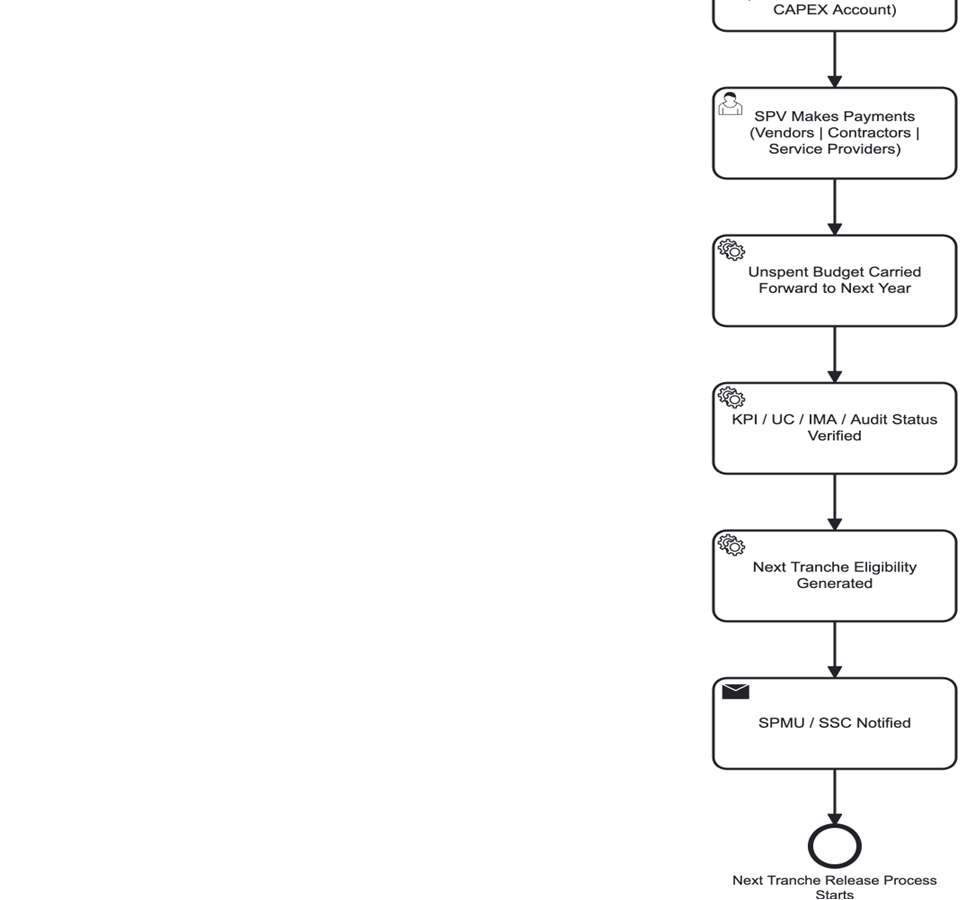
7.2.8 Fund flow / tranche release eligibility
No caption in source
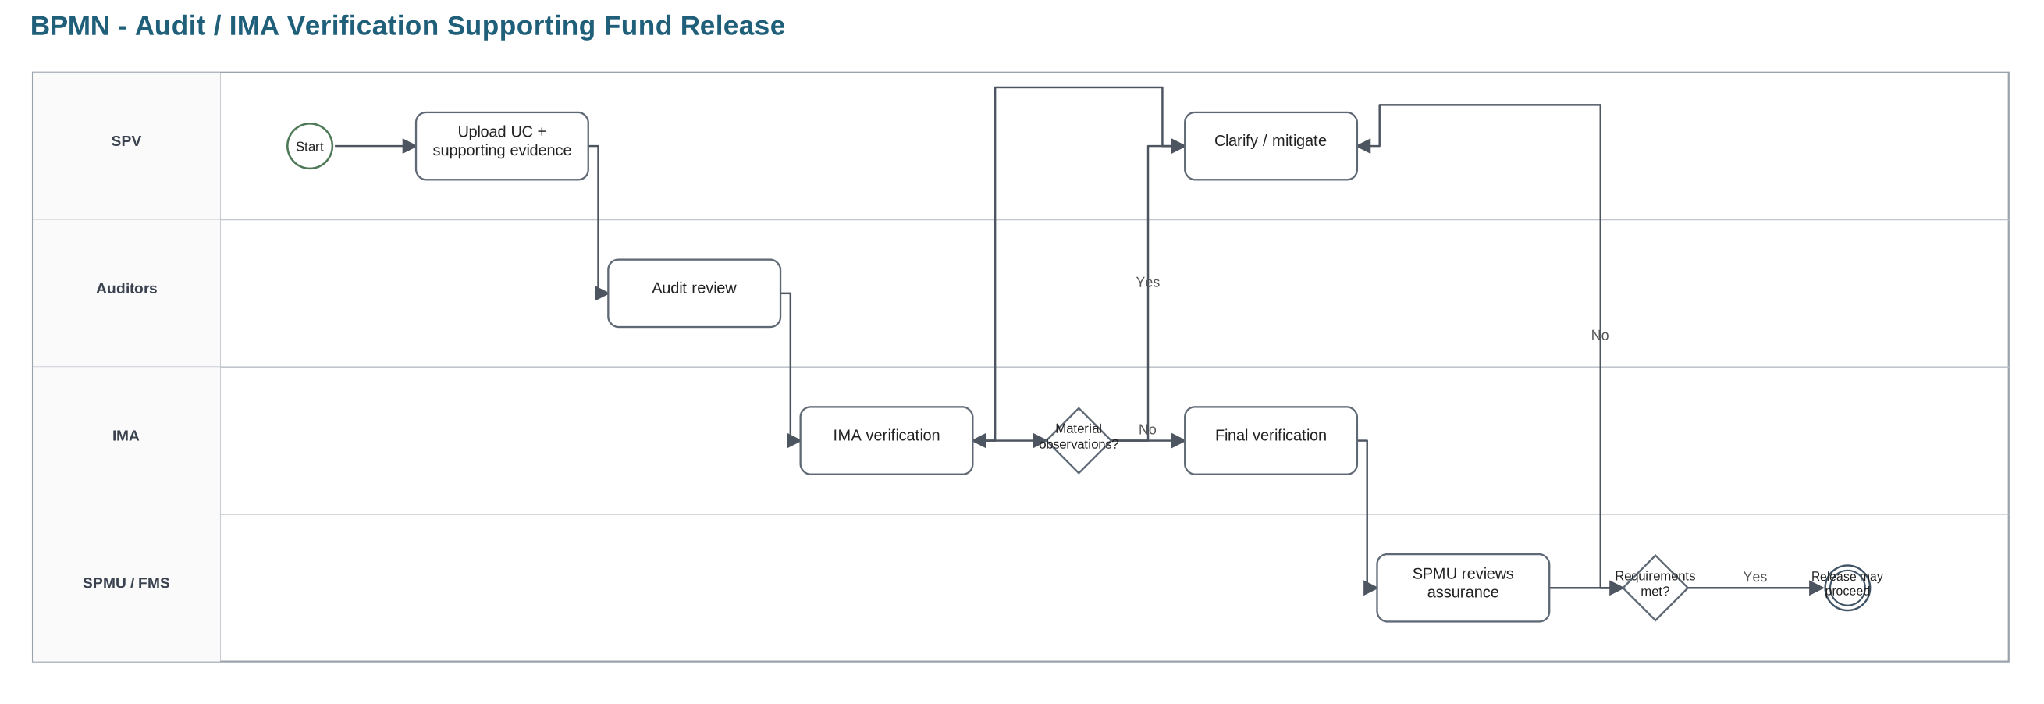
7.2.9 Audit / IMA verification supporting release
No caption in source
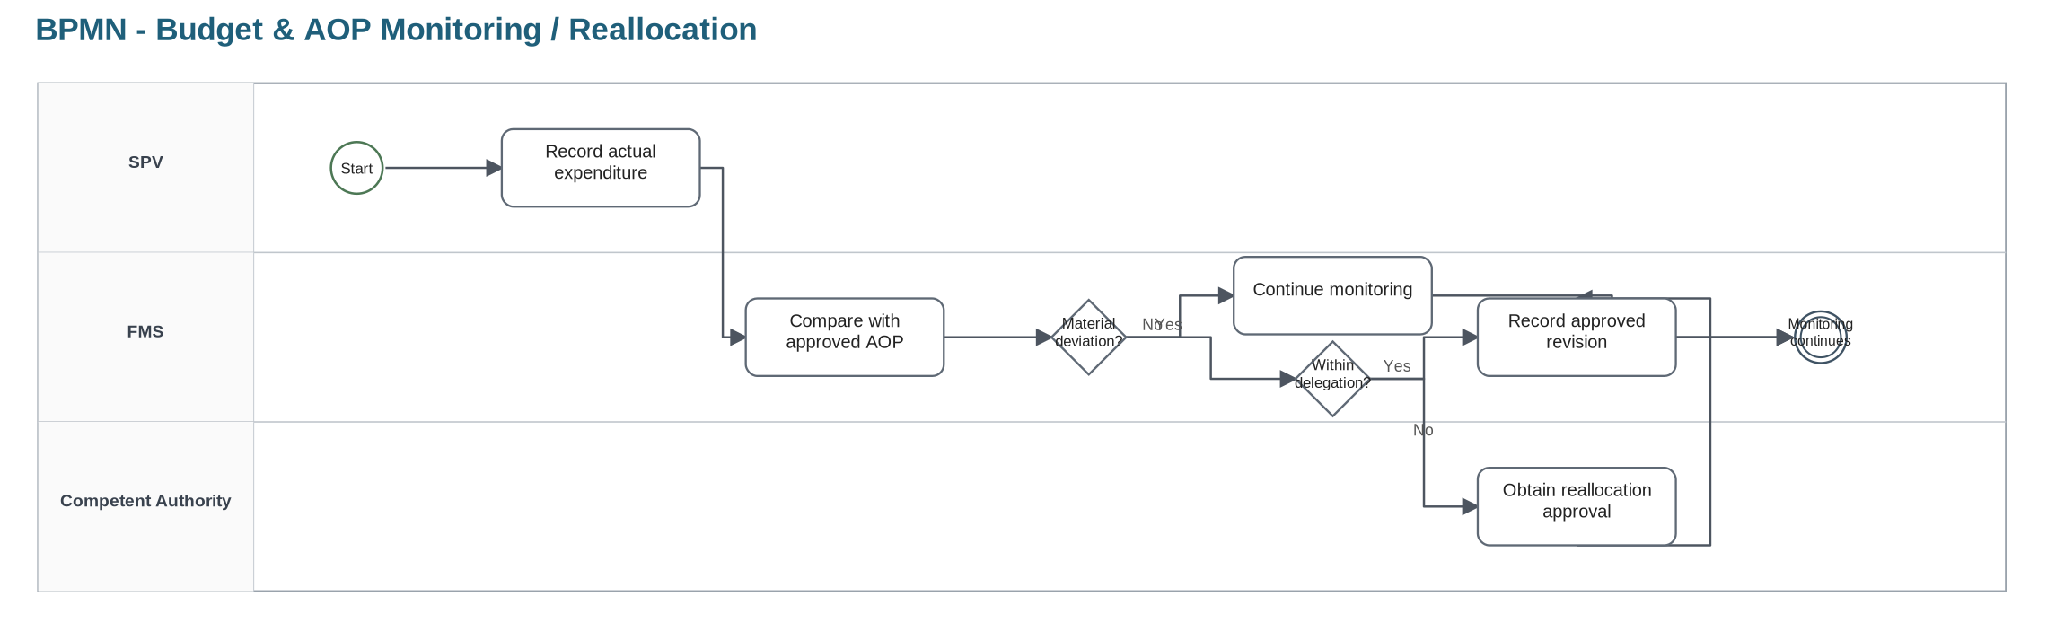
7.2.10 Budget / AOP reallocation monitoring
No caption in source
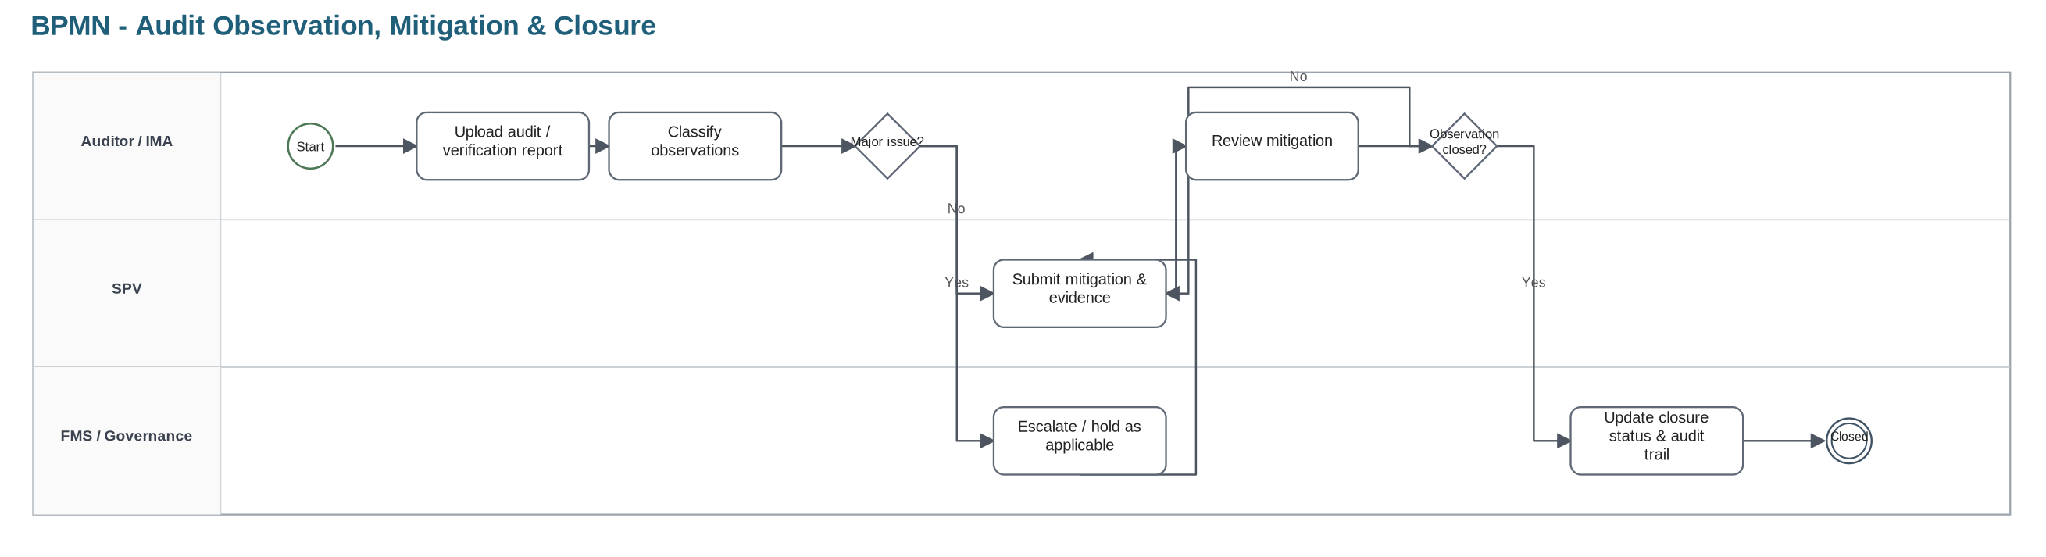
7.2.11 Audit observation mitigation
No caption in source
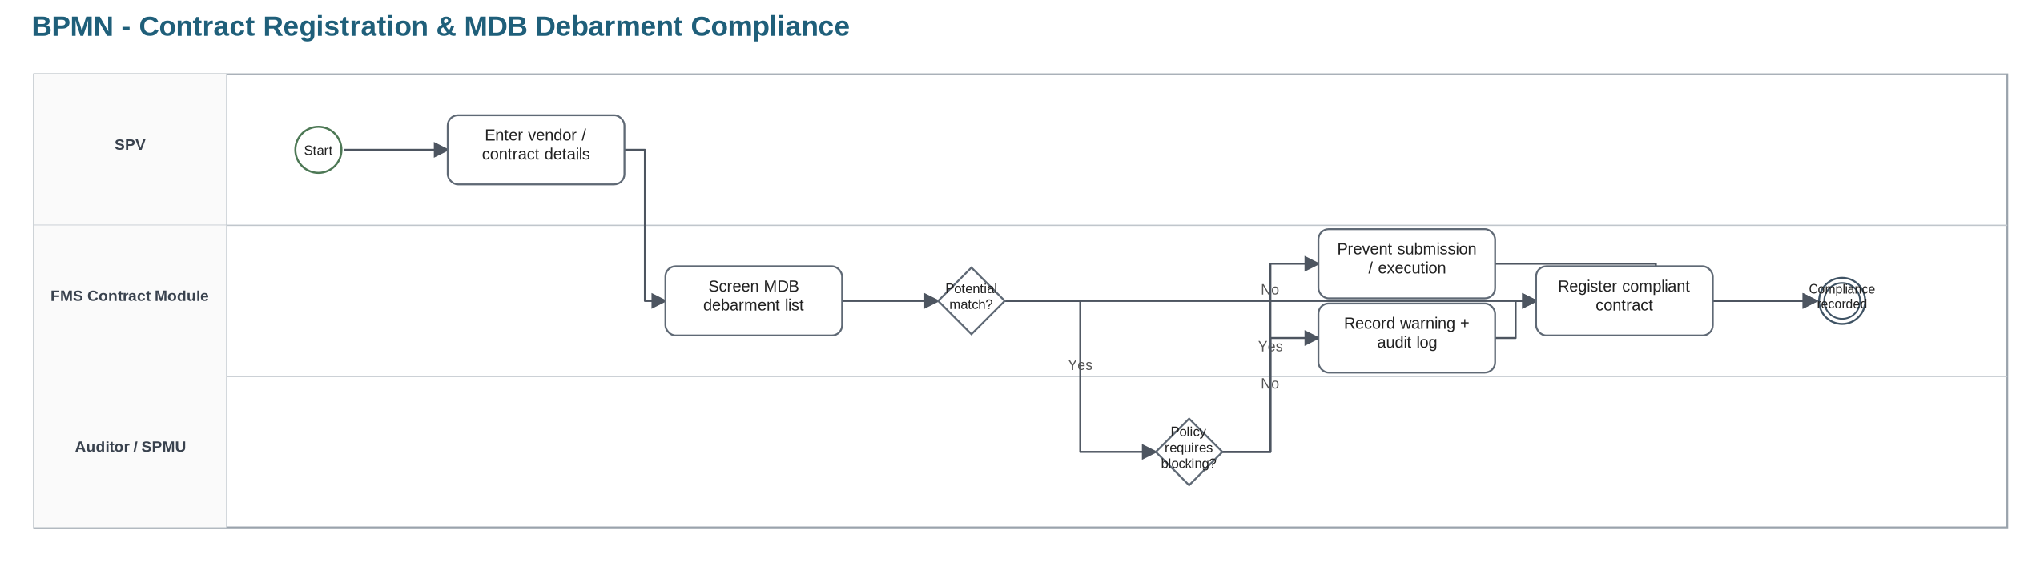
7.2.12 Contract / MDB compliance
No caption in source
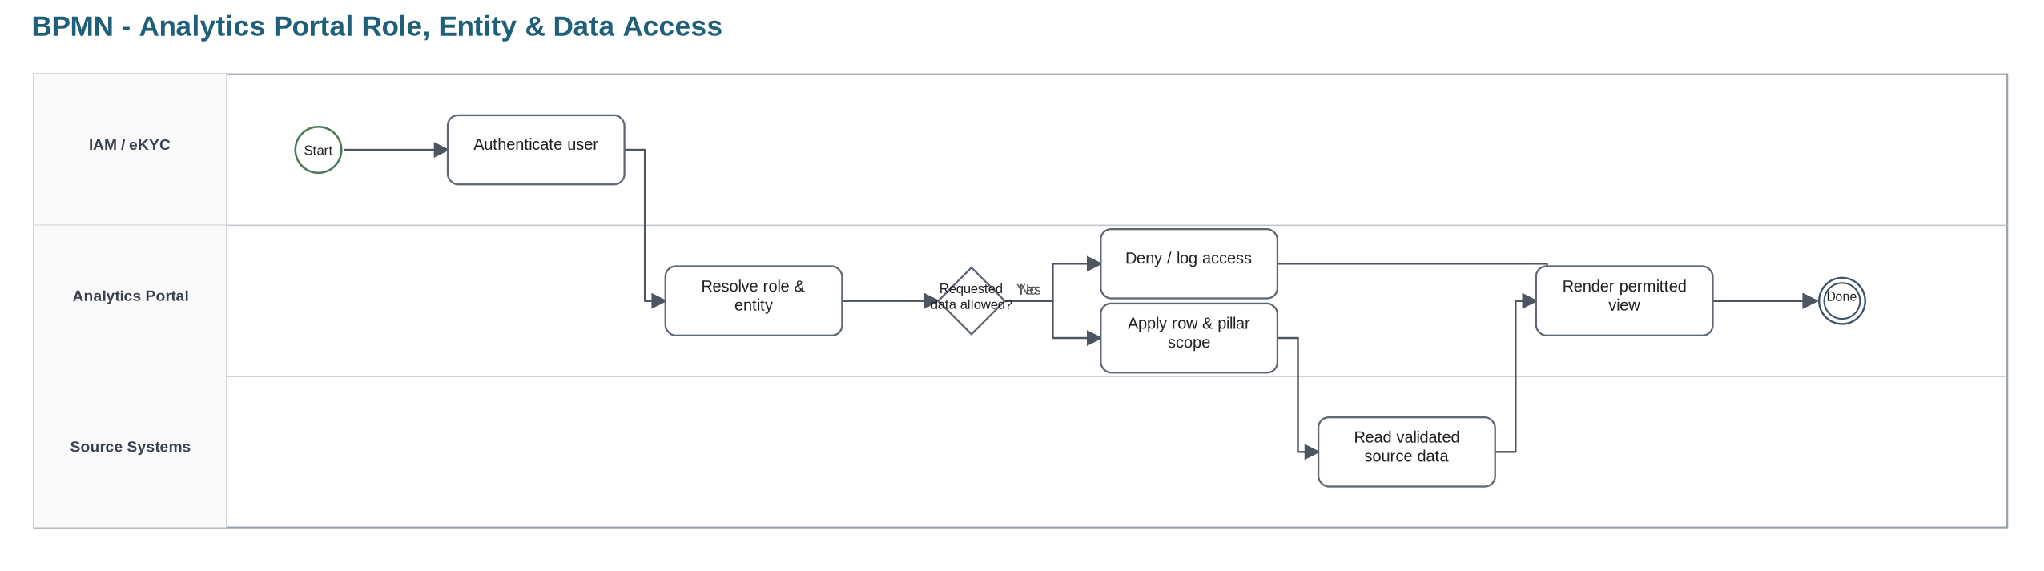
7.2.13 Analytics role/entity access
No caption in source
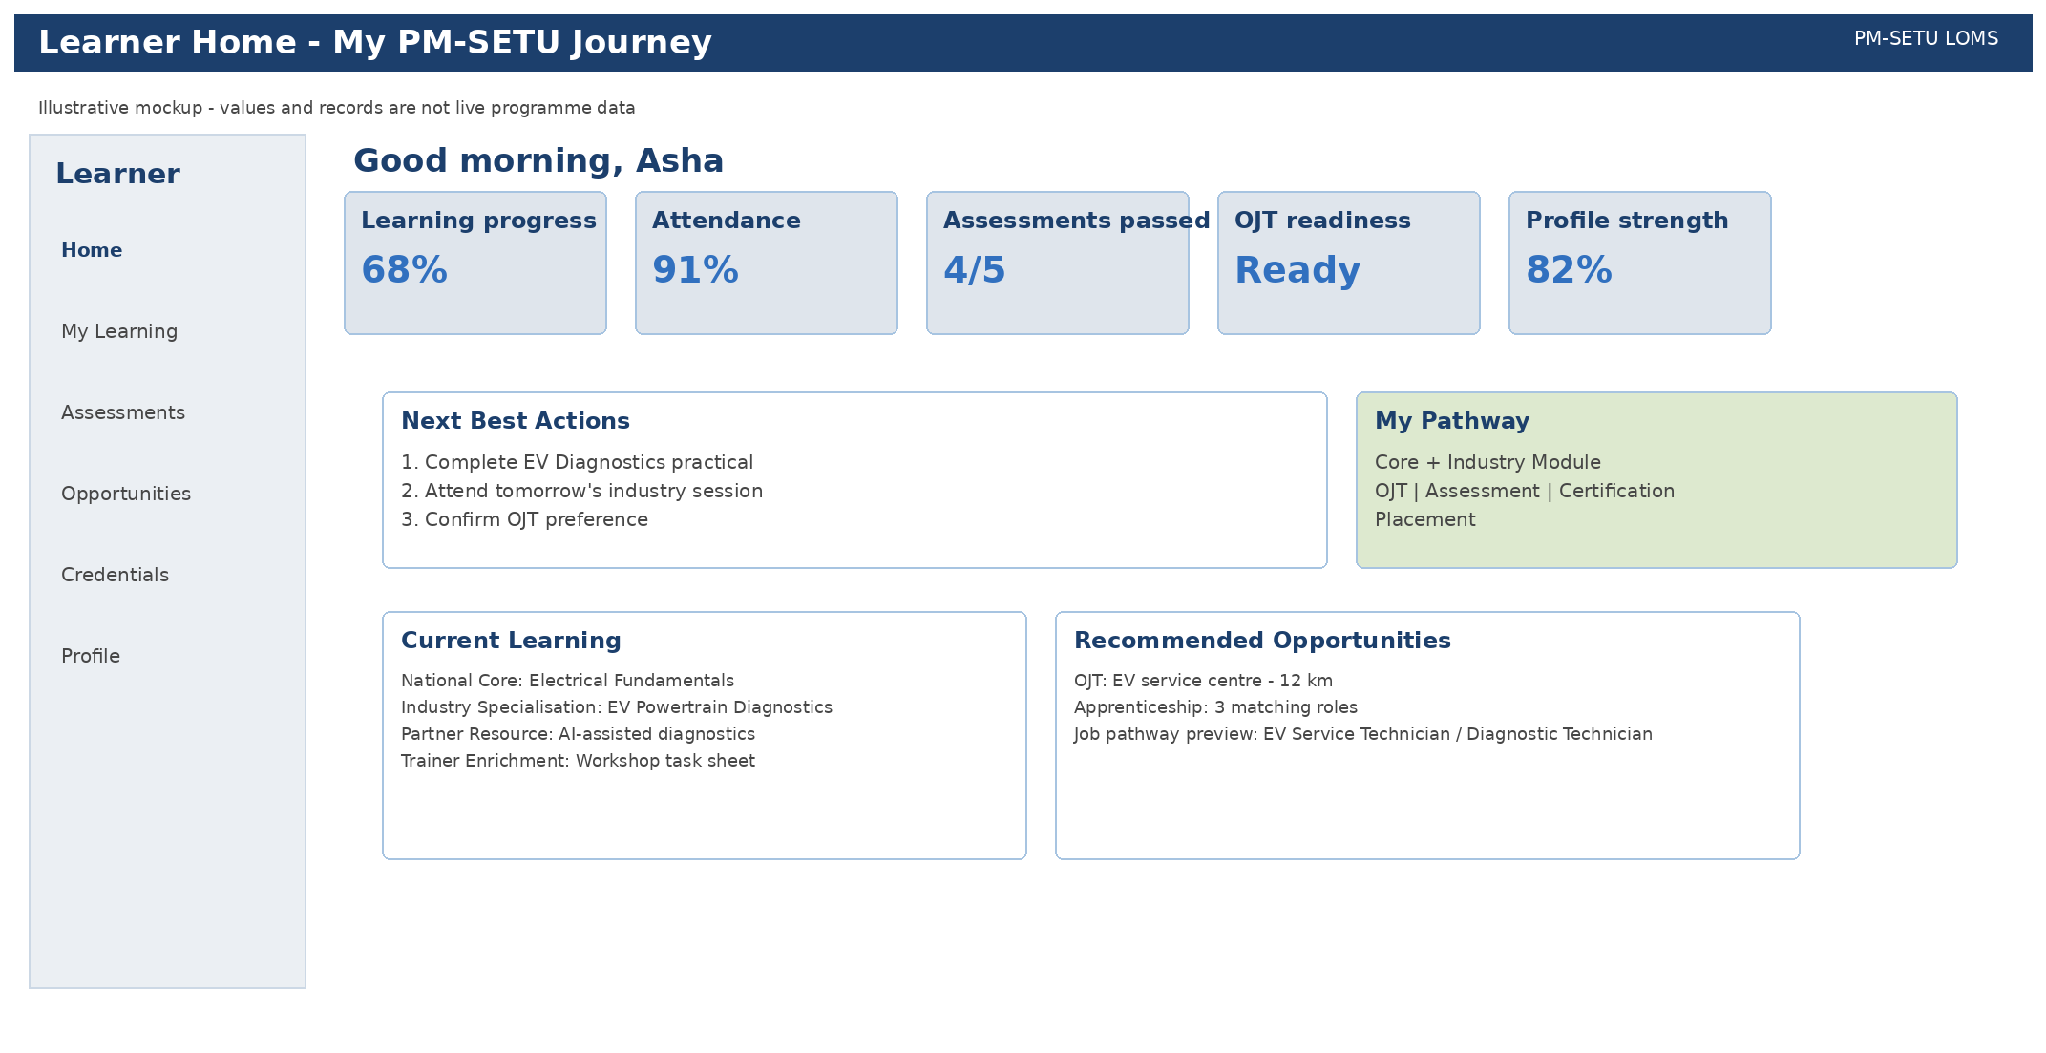
7.3.1 Learner PM-SETU home
No caption in source
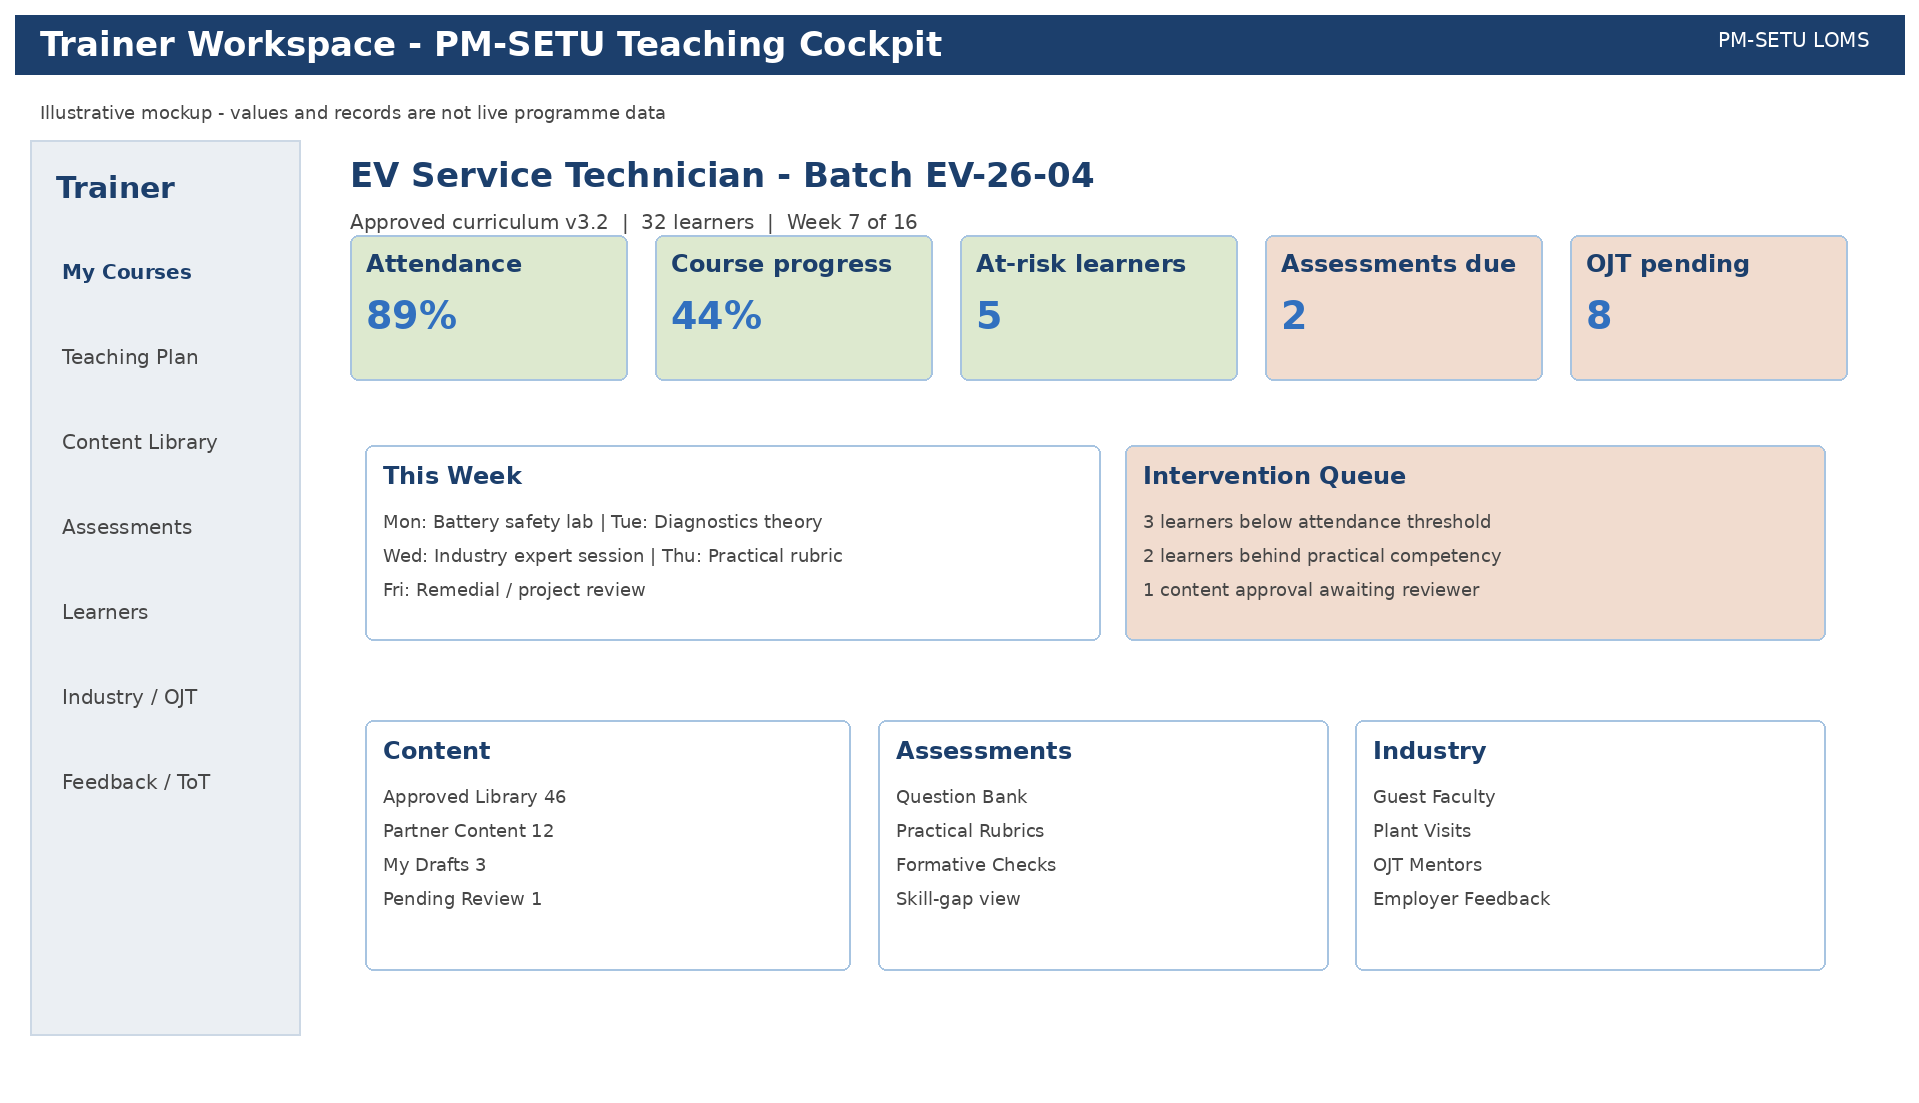
7.3.2 Trainer teaching cockpit
No caption in source
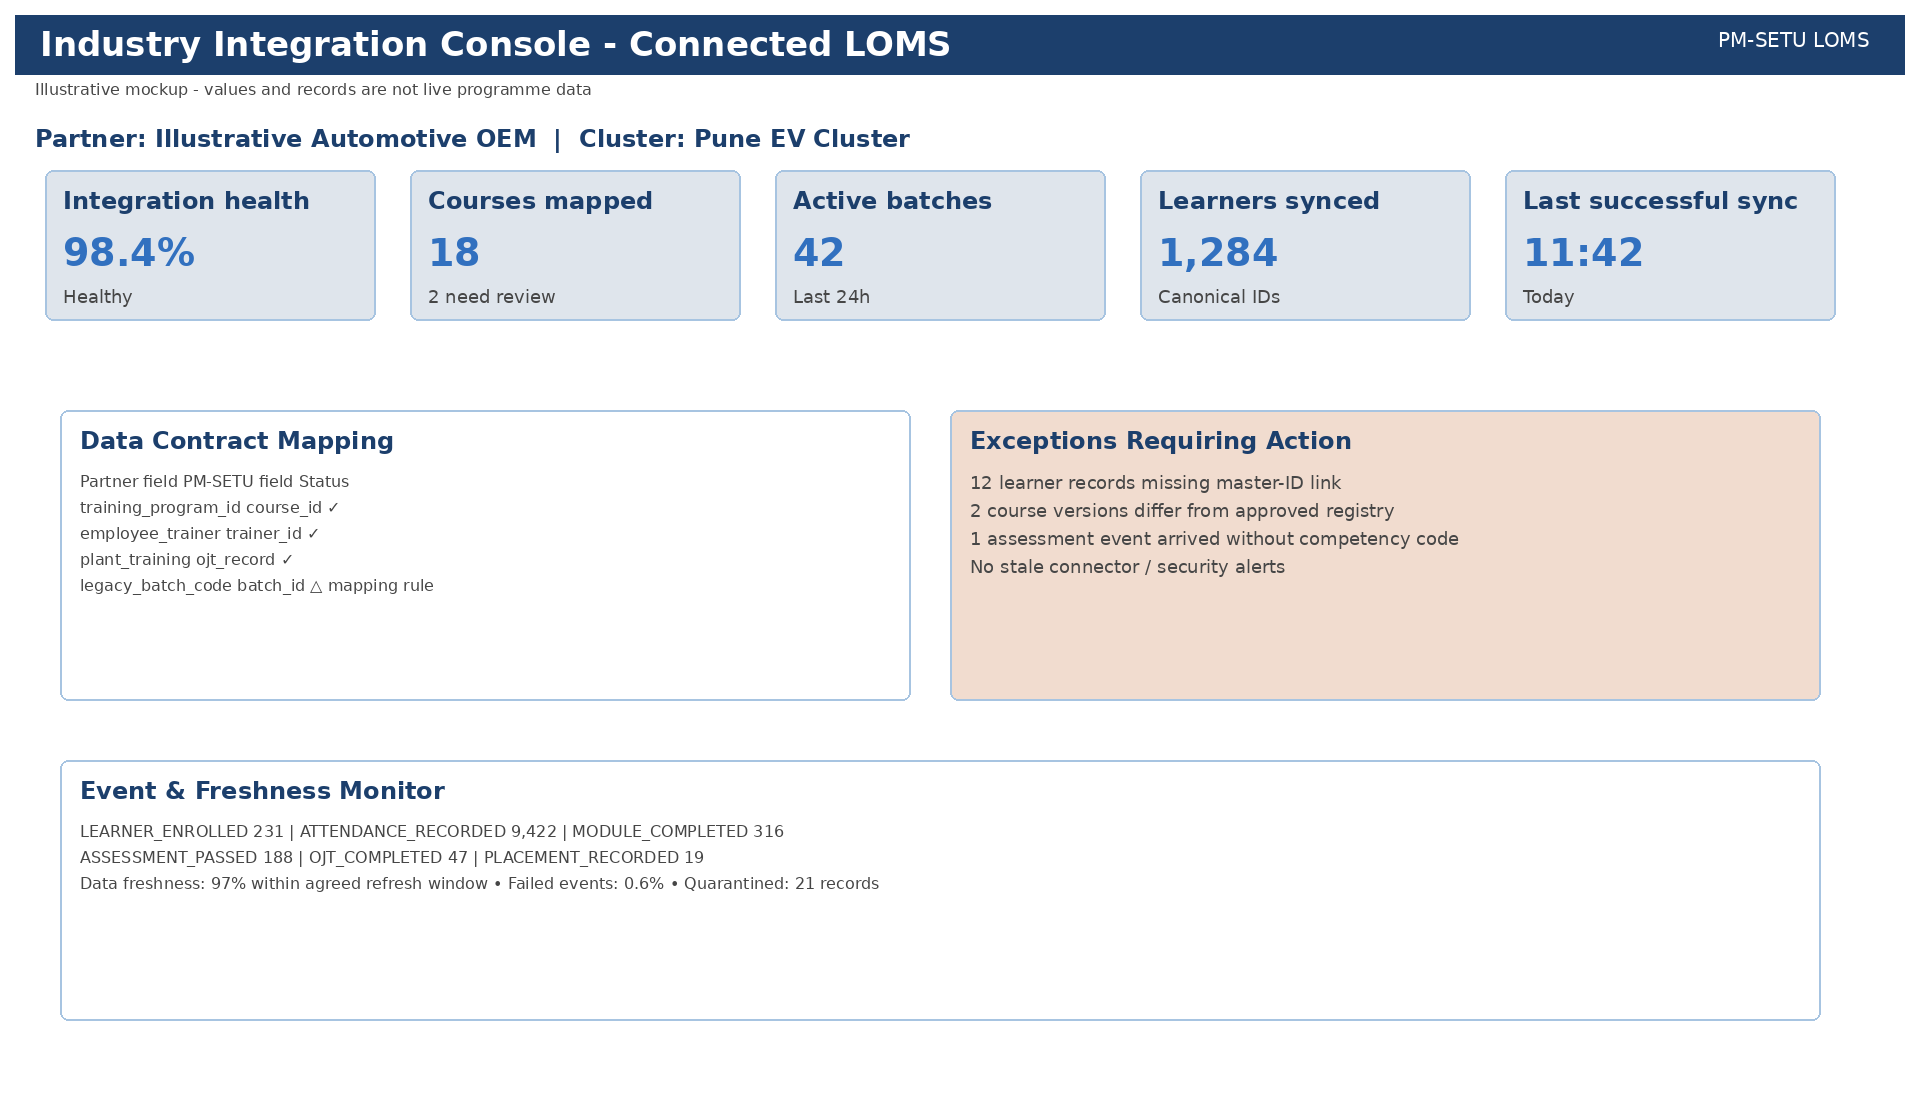
7.3.3 Industry Integration Console
No caption in source
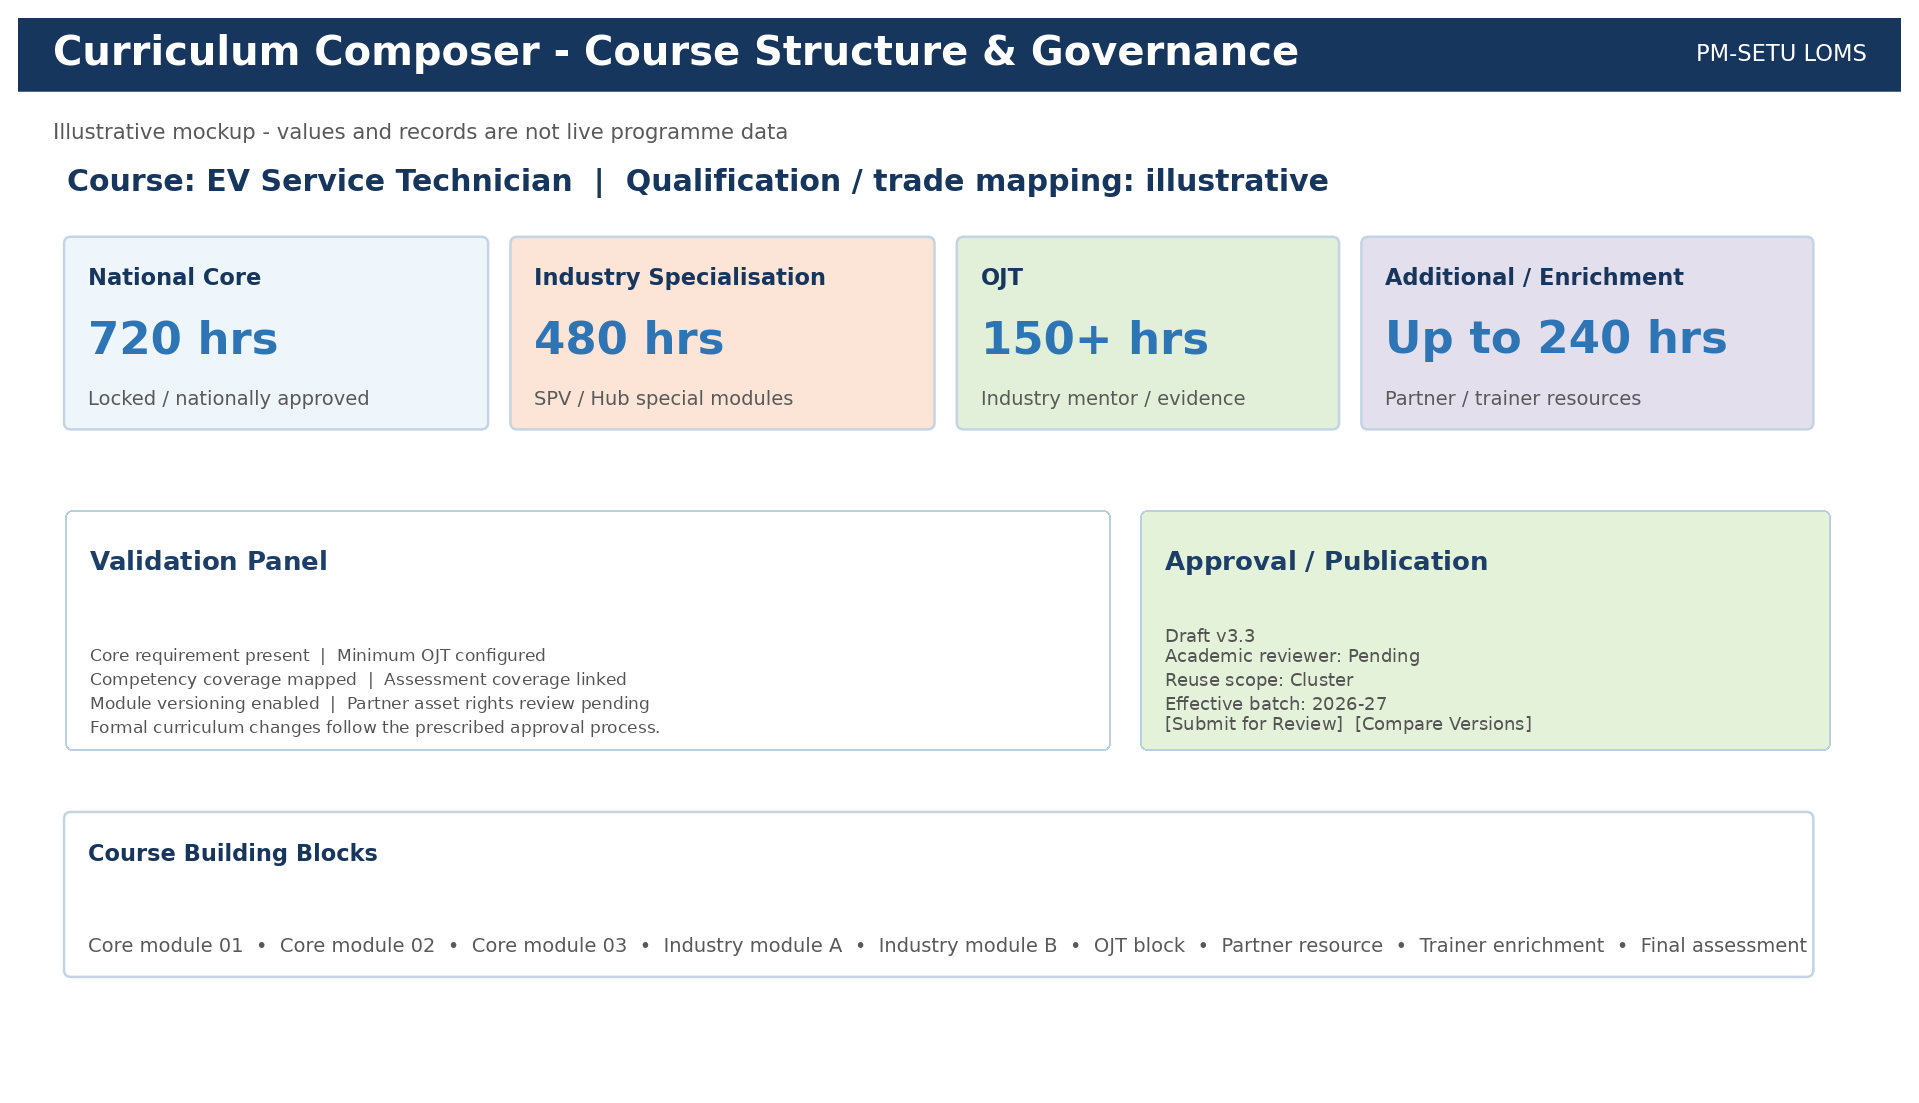
7.3.4 Curriculum Composer
No caption in source
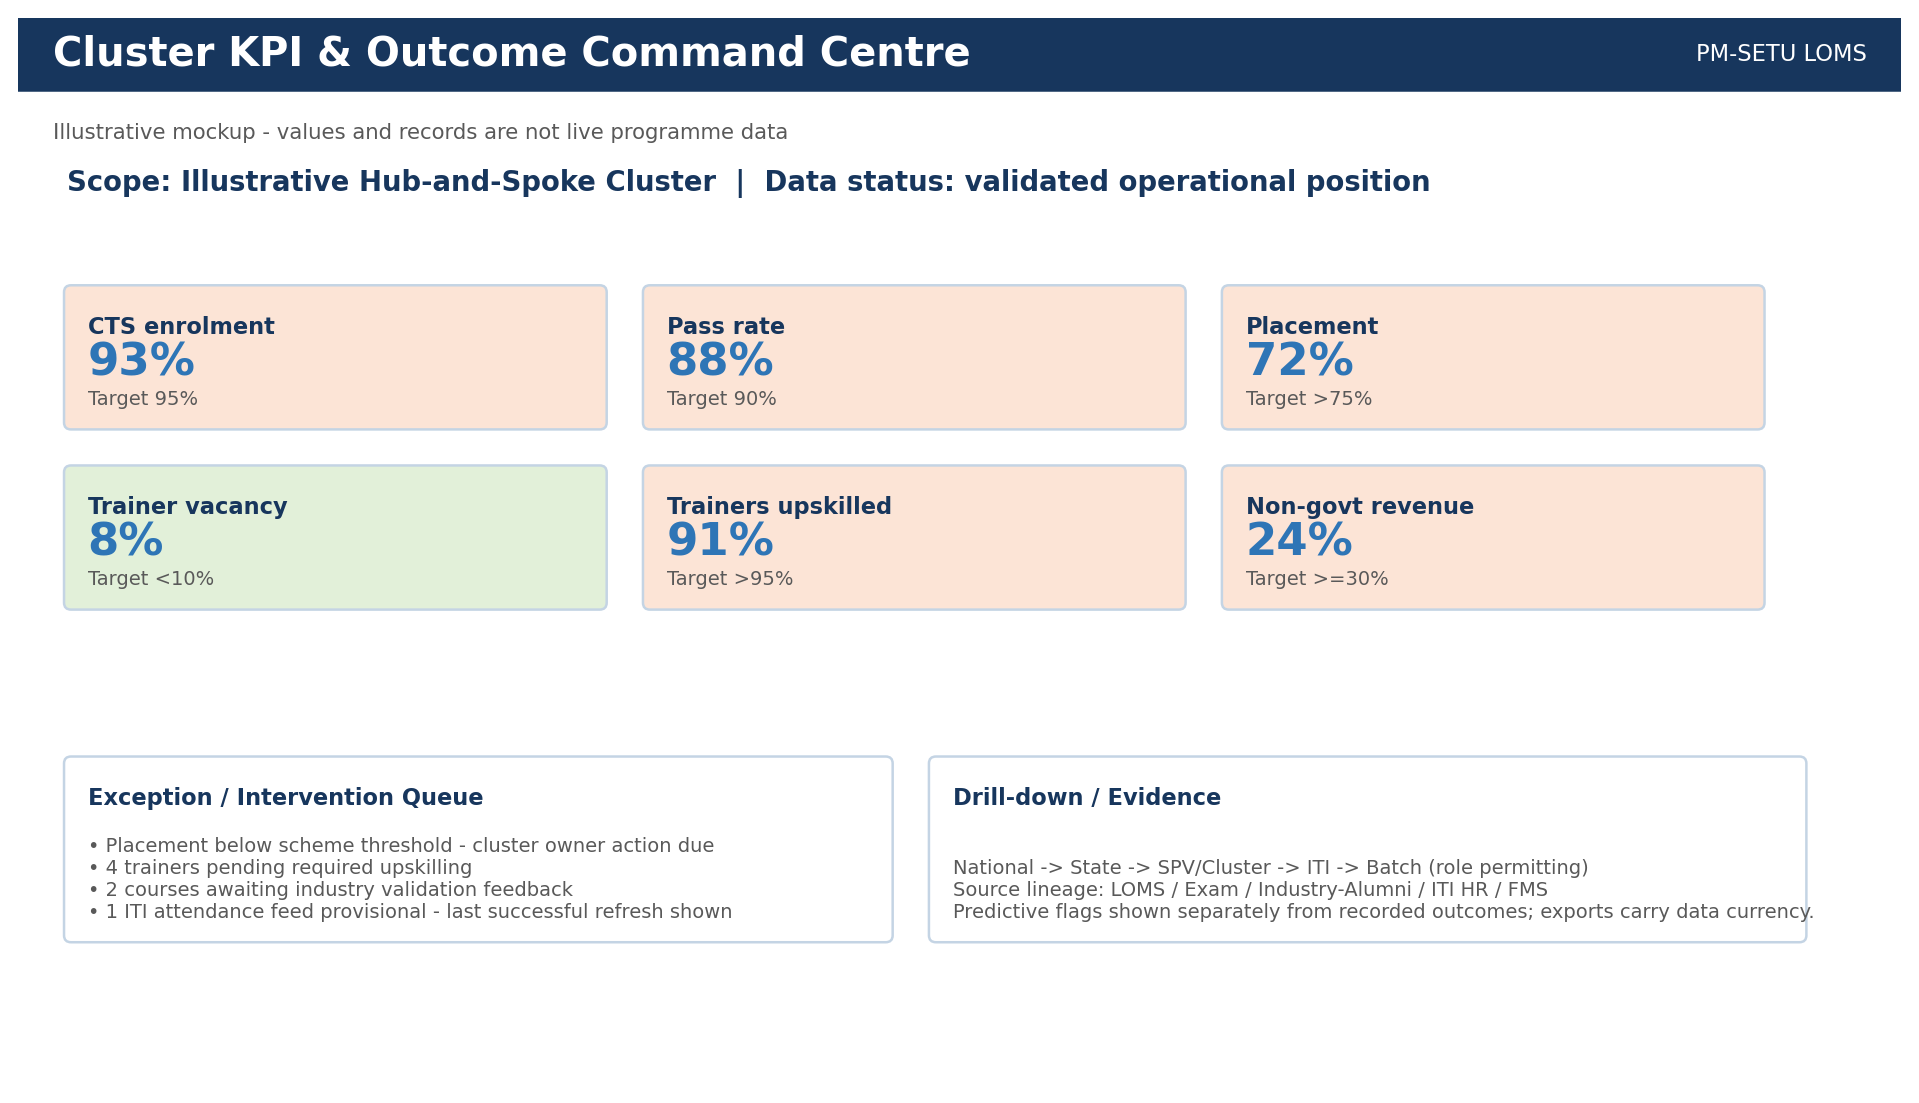
7.3.5 Cluster KPI Command Centre
No caption in source
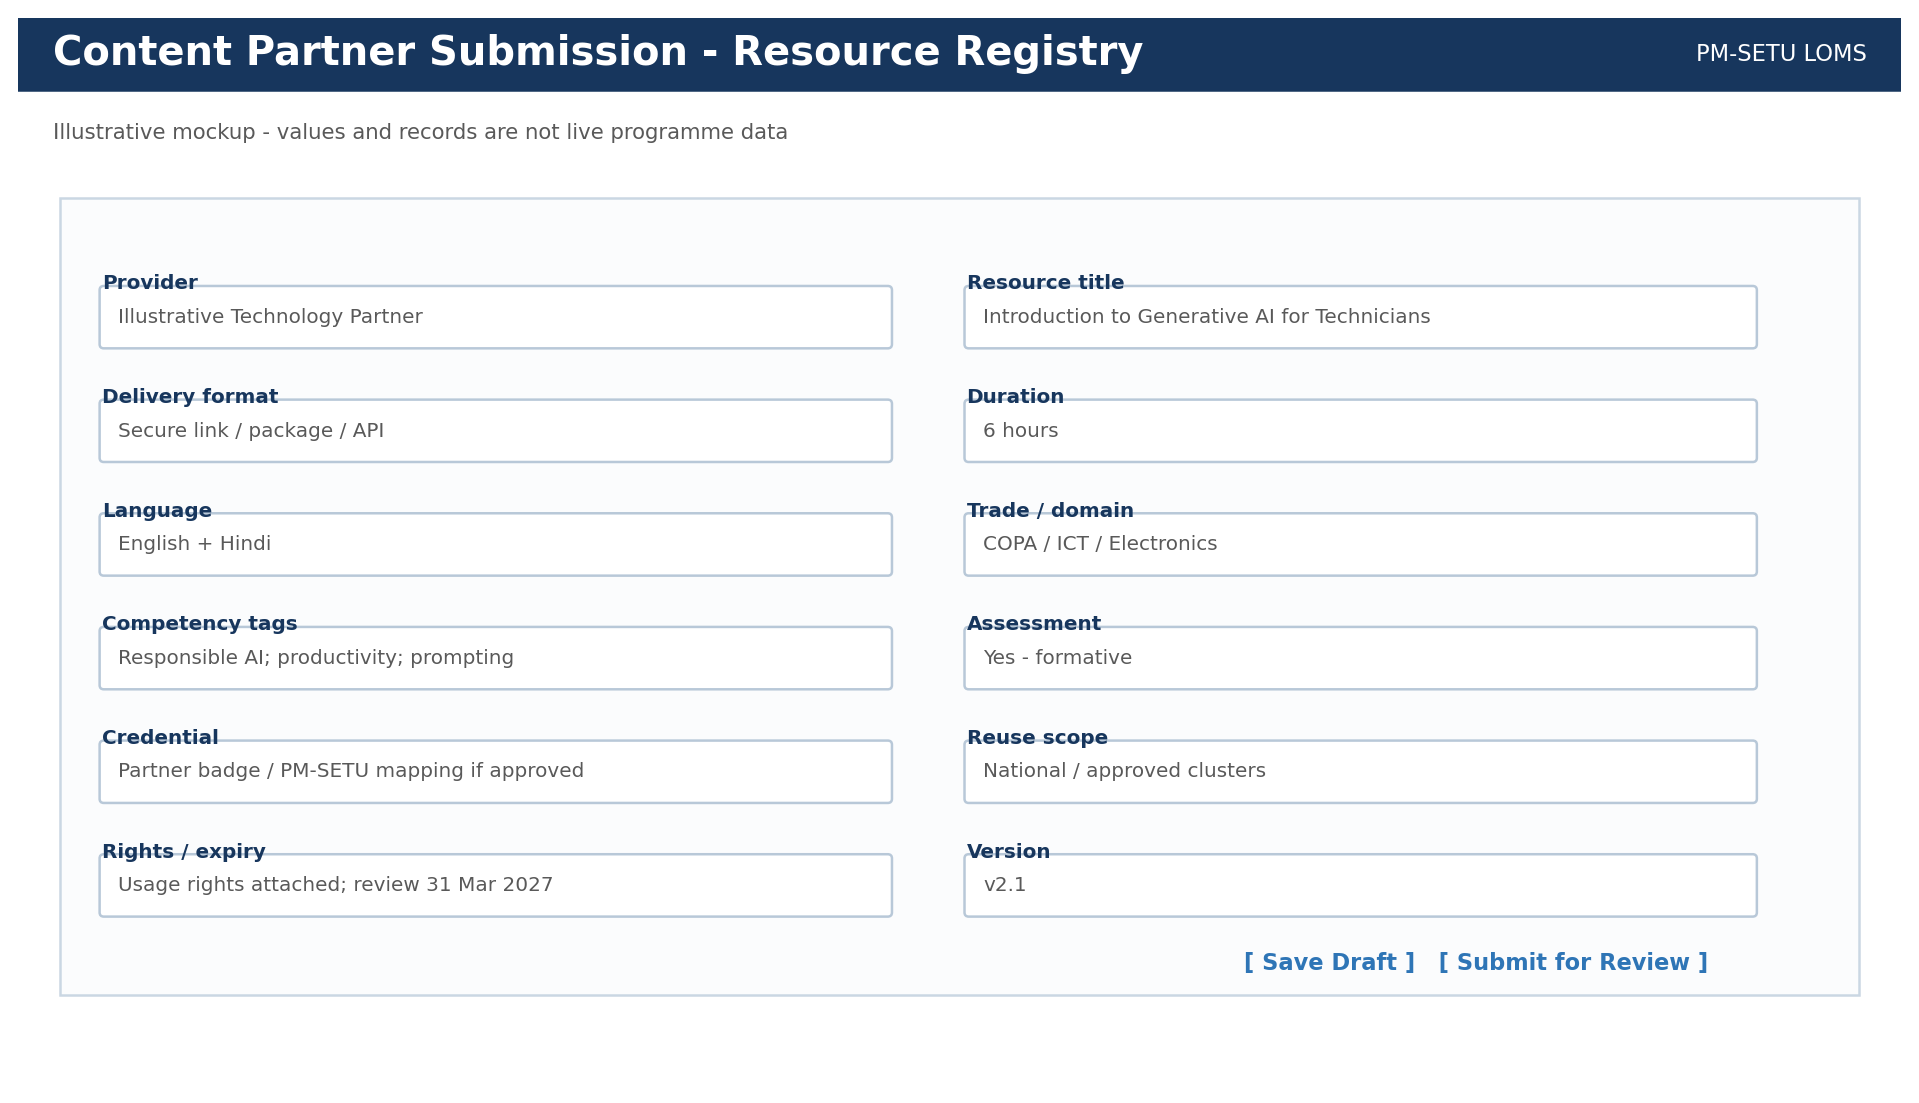
7.3.6 Content Partner Submission
No caption in source
Performance Analytics Module (33 diagrams)
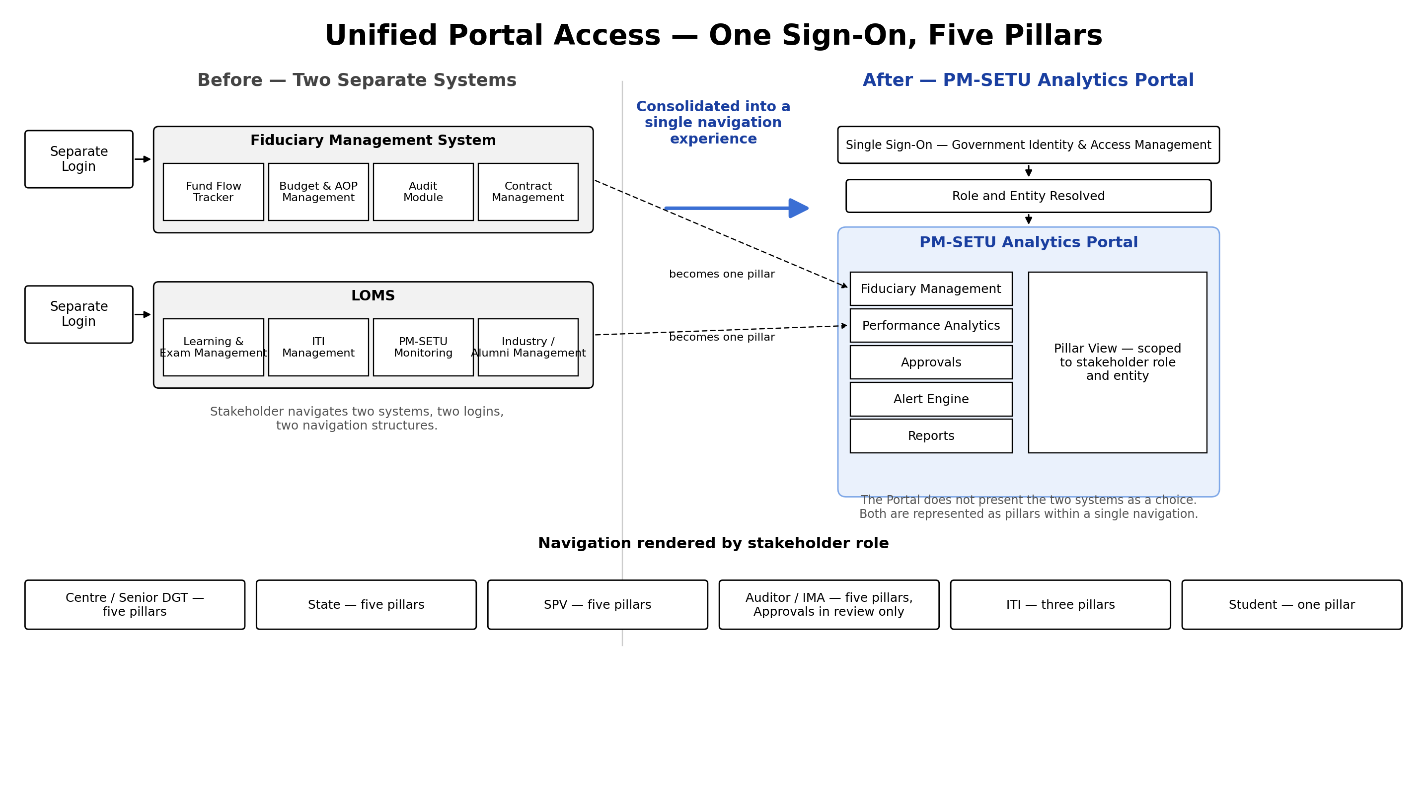
2.1. Portal Access & Login
No caption in source
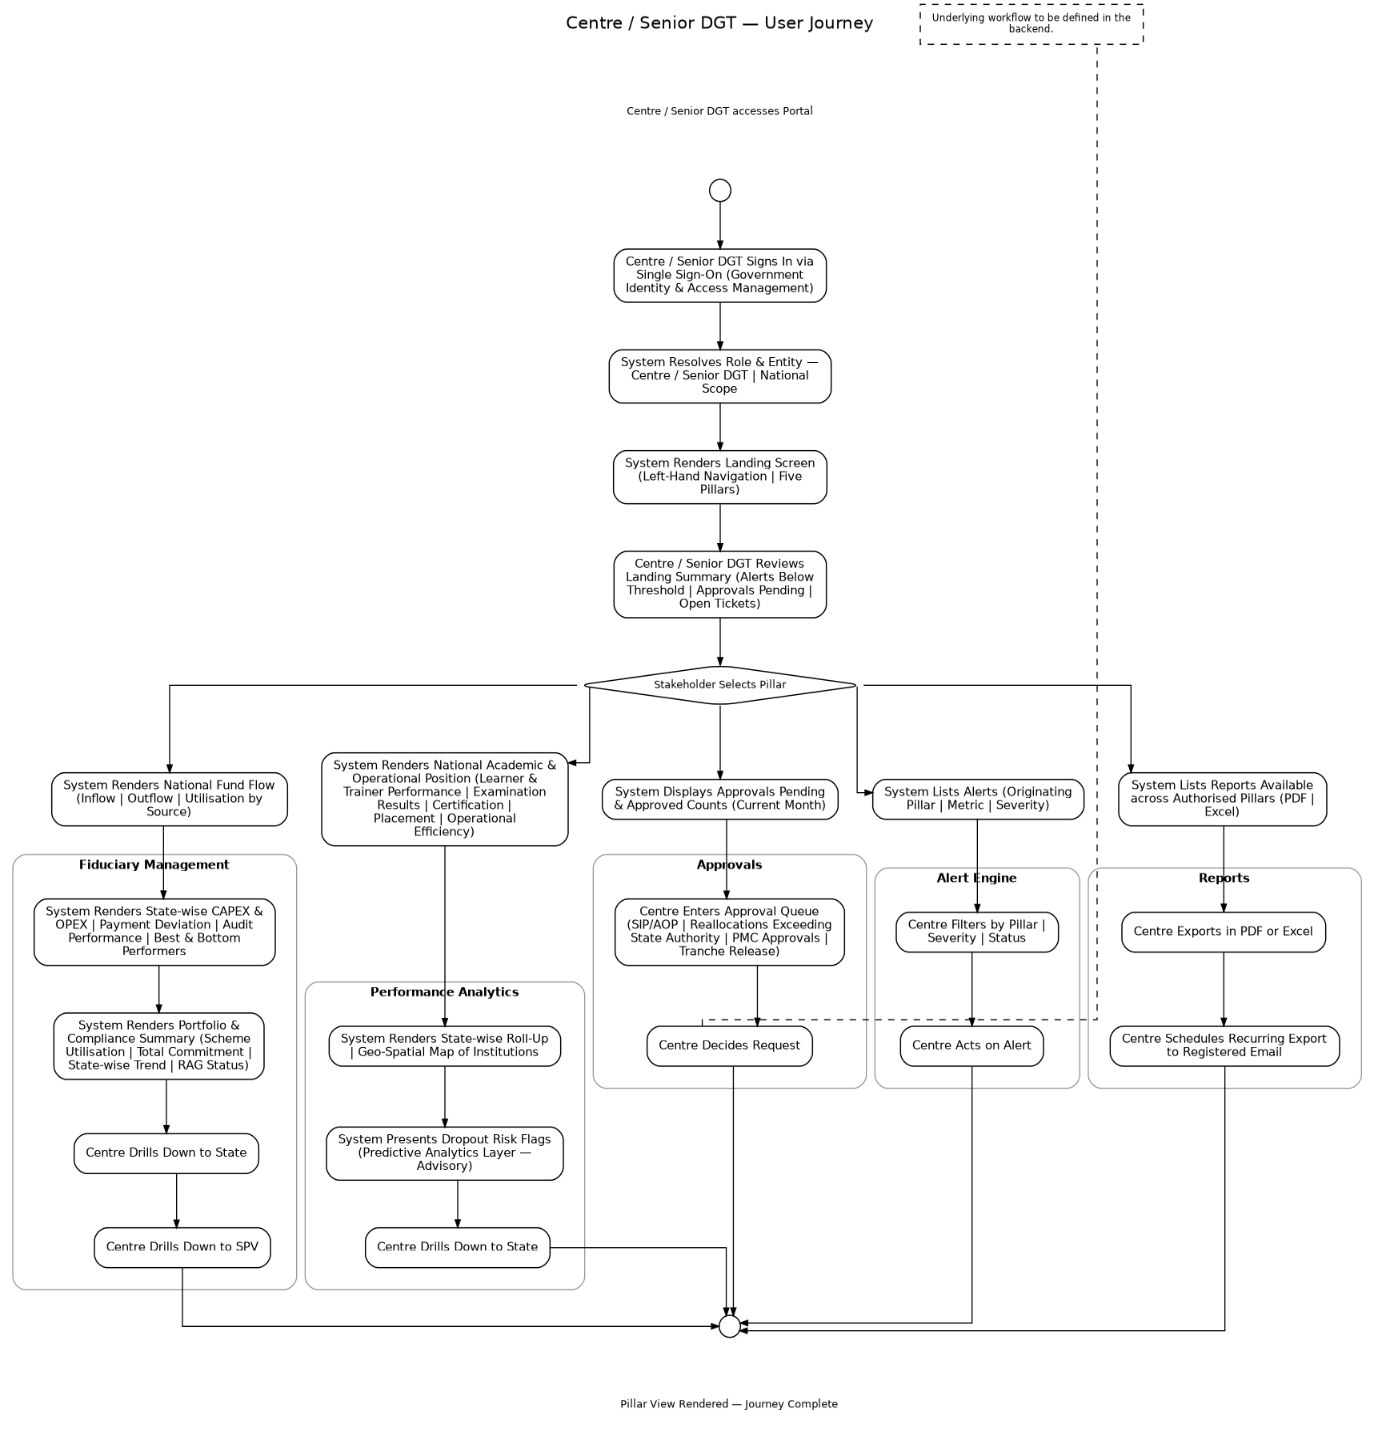
2.2. Centre User Journey
No caption in source
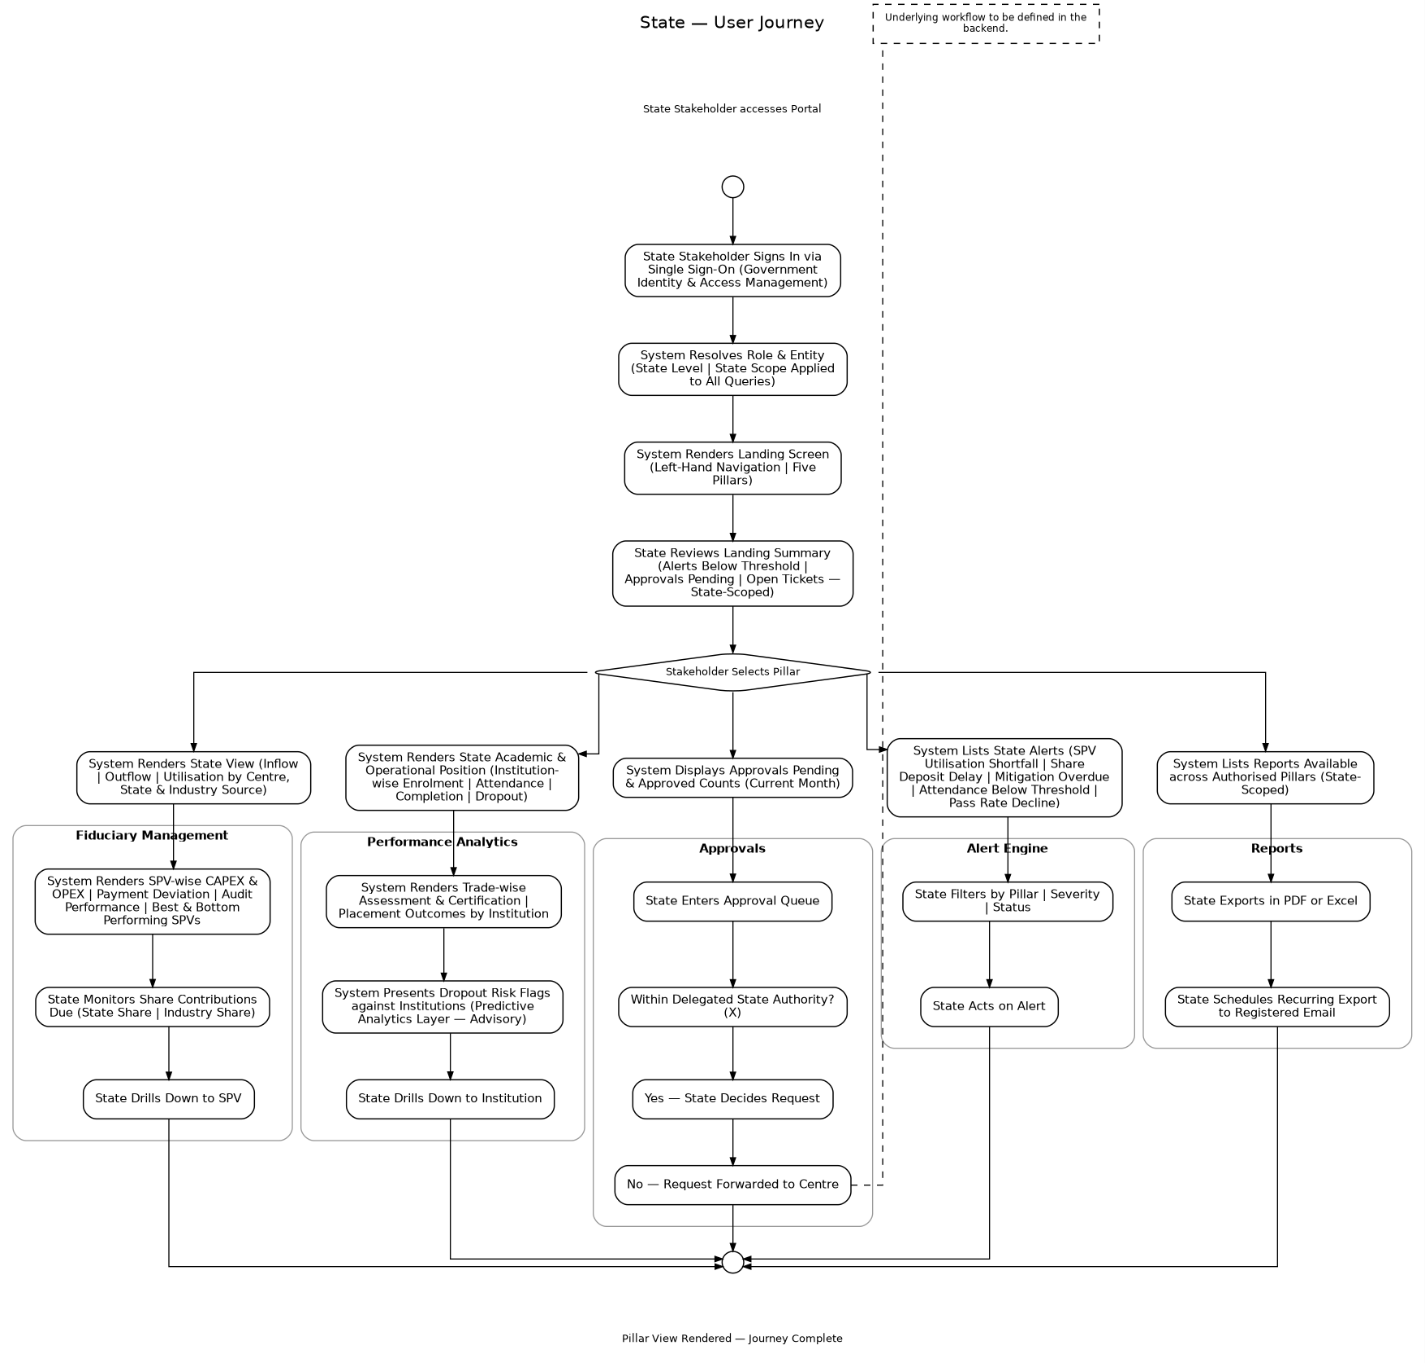
2.3. State, User Journey
No caption in source
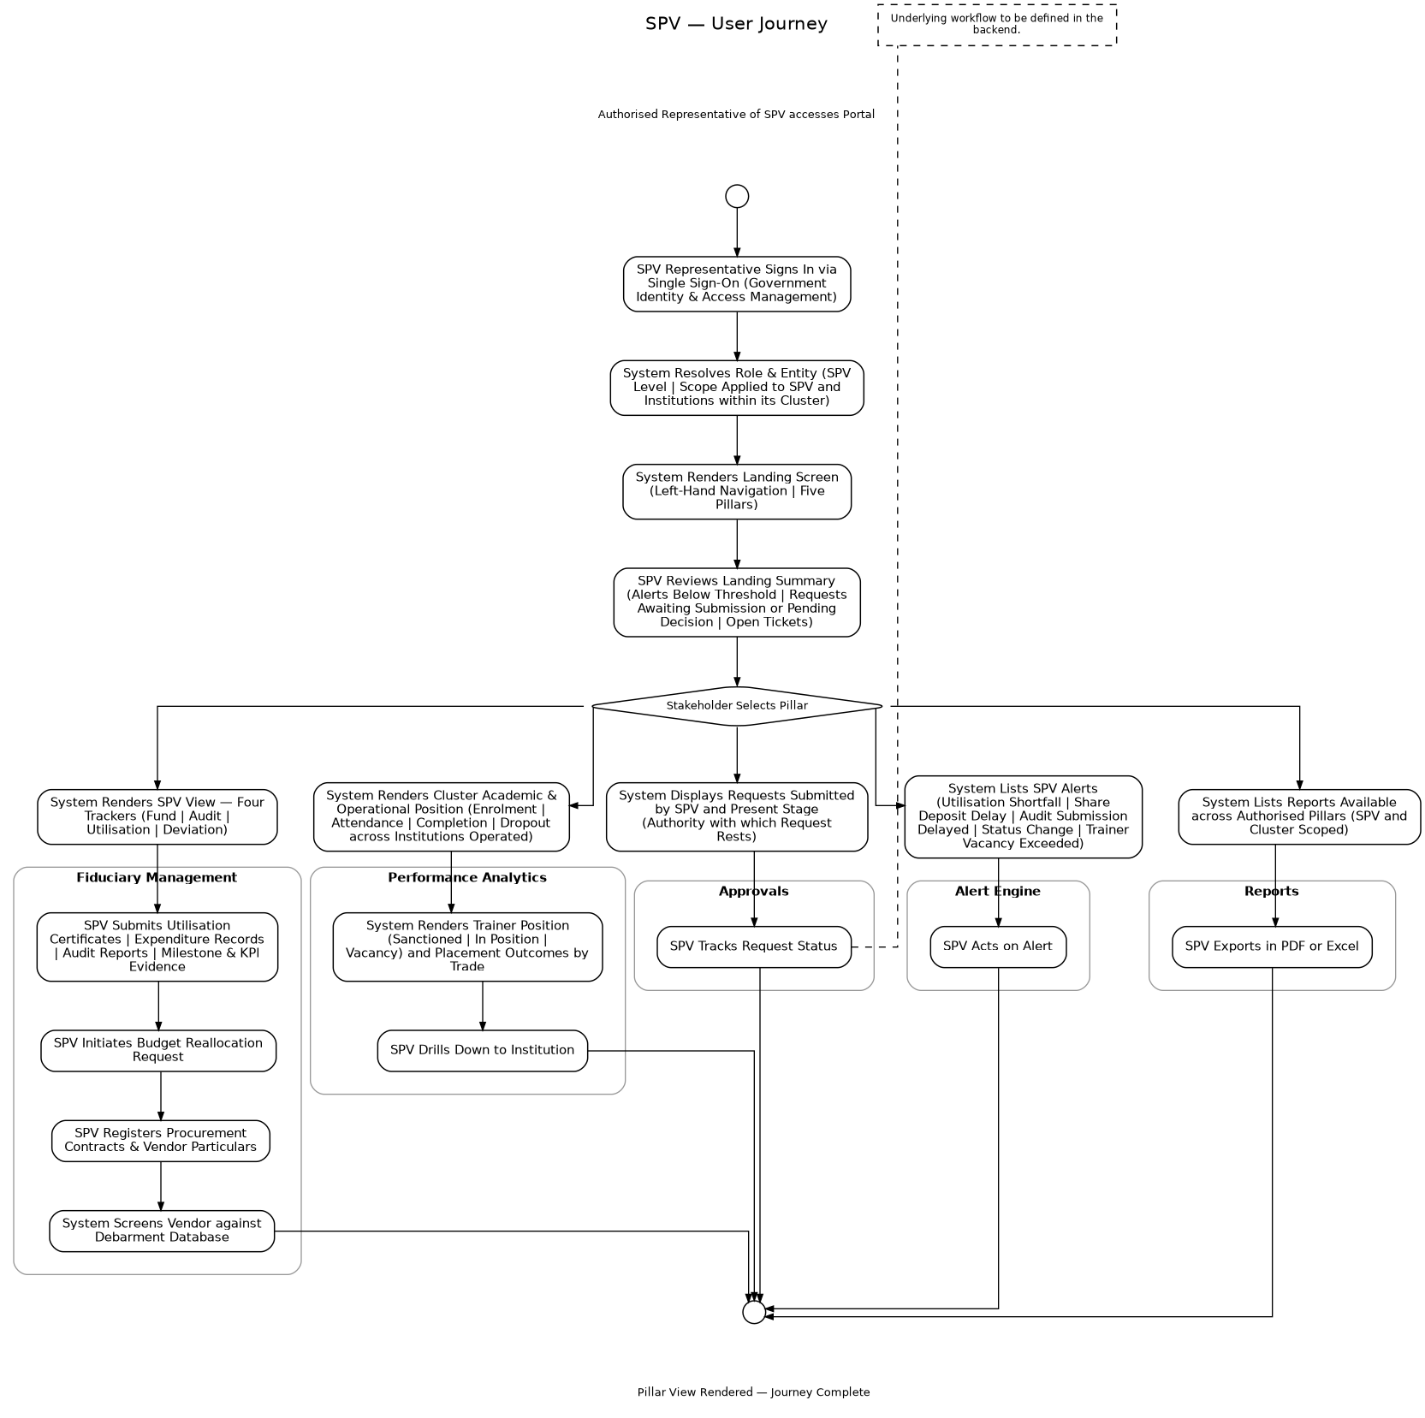
2.4. SPV, User Journey
No caption in source
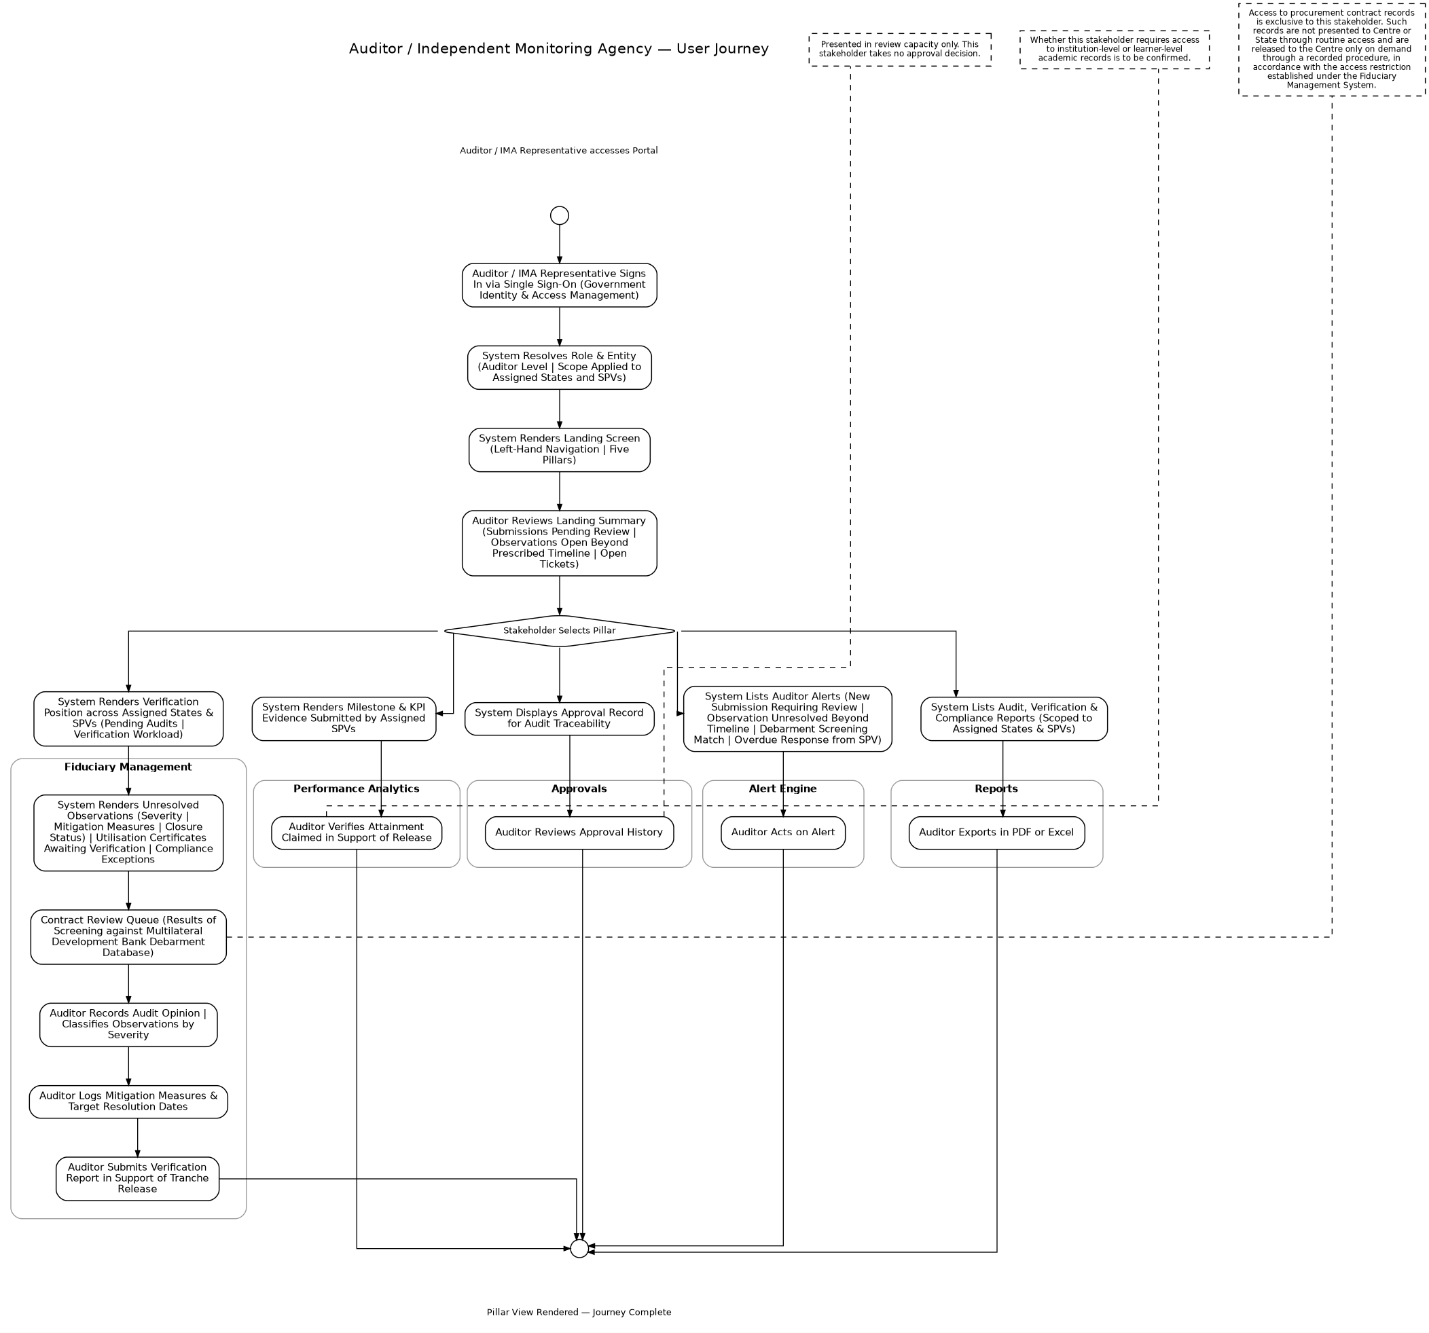
2.5. Auditor, User Journey
No caption in source
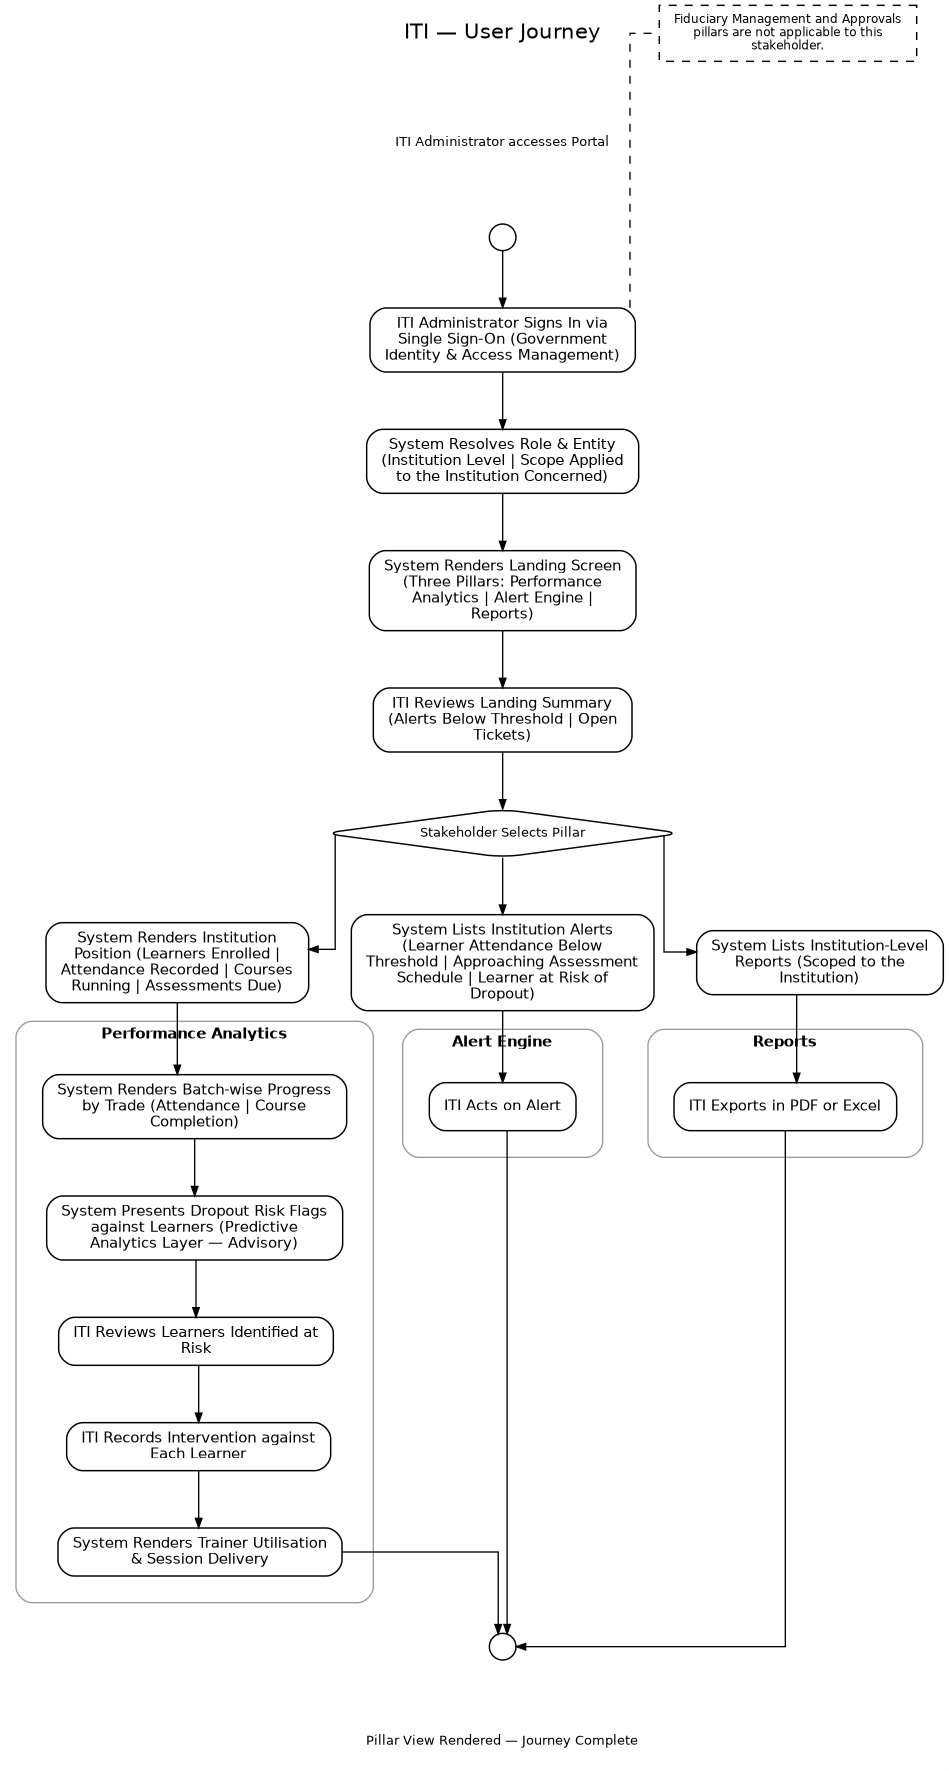
2.6. ITI, User Journey
No caption in source
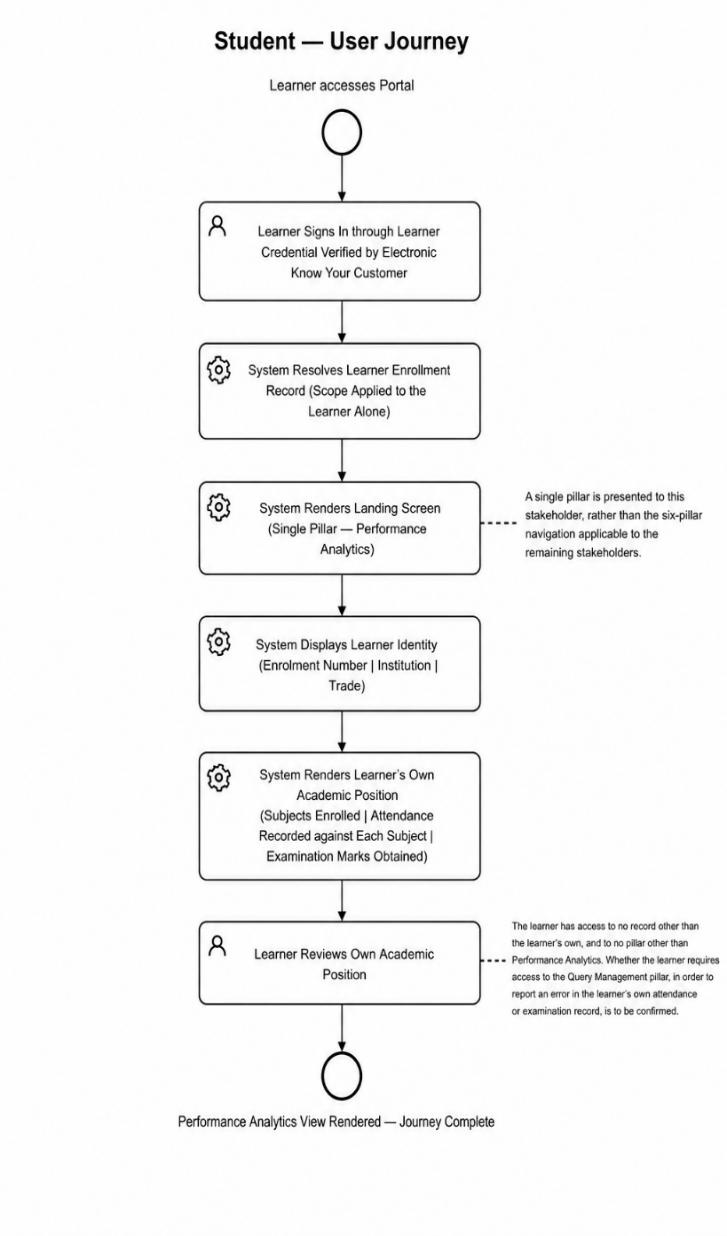
2.6. ITI, User Journey
No caption in source
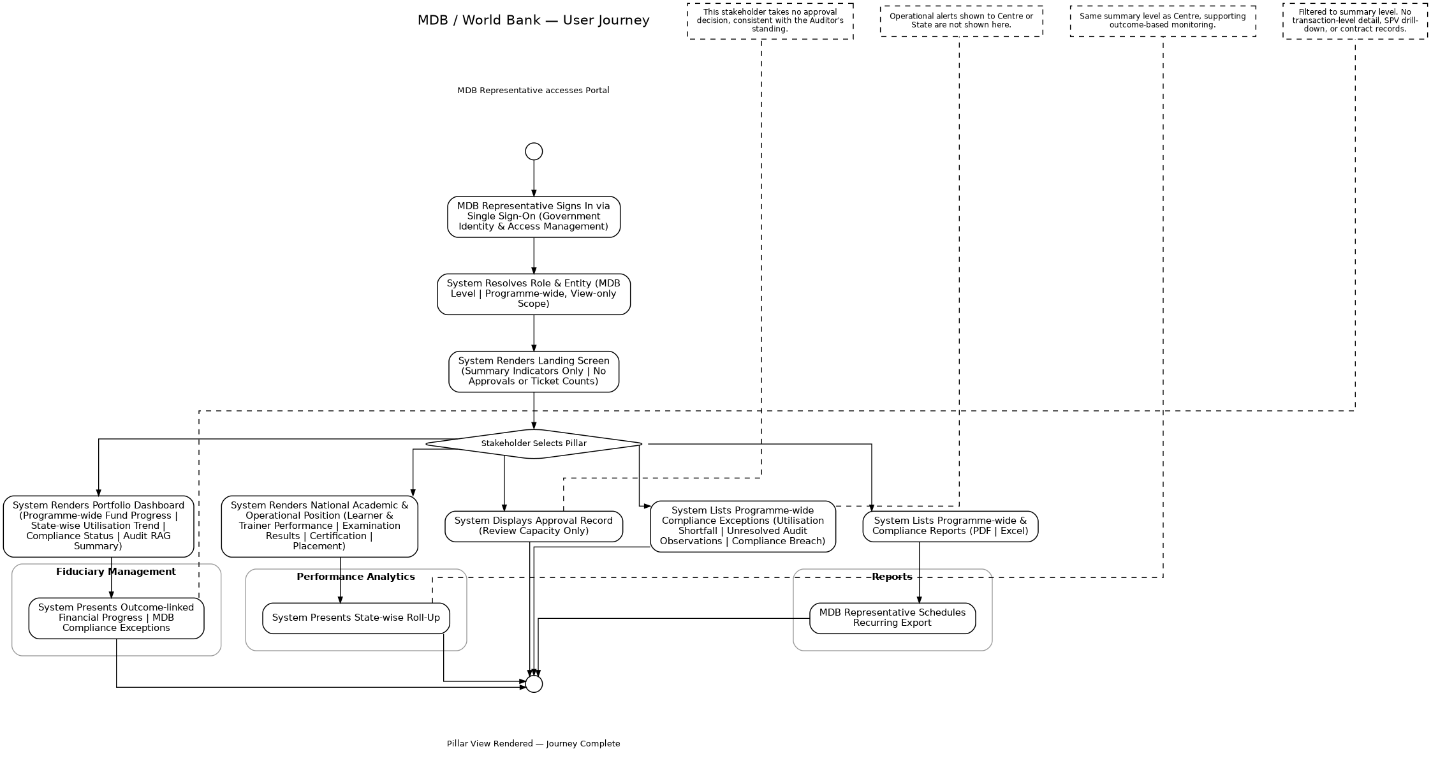
2.8. MDB, User Journey
No caption in source
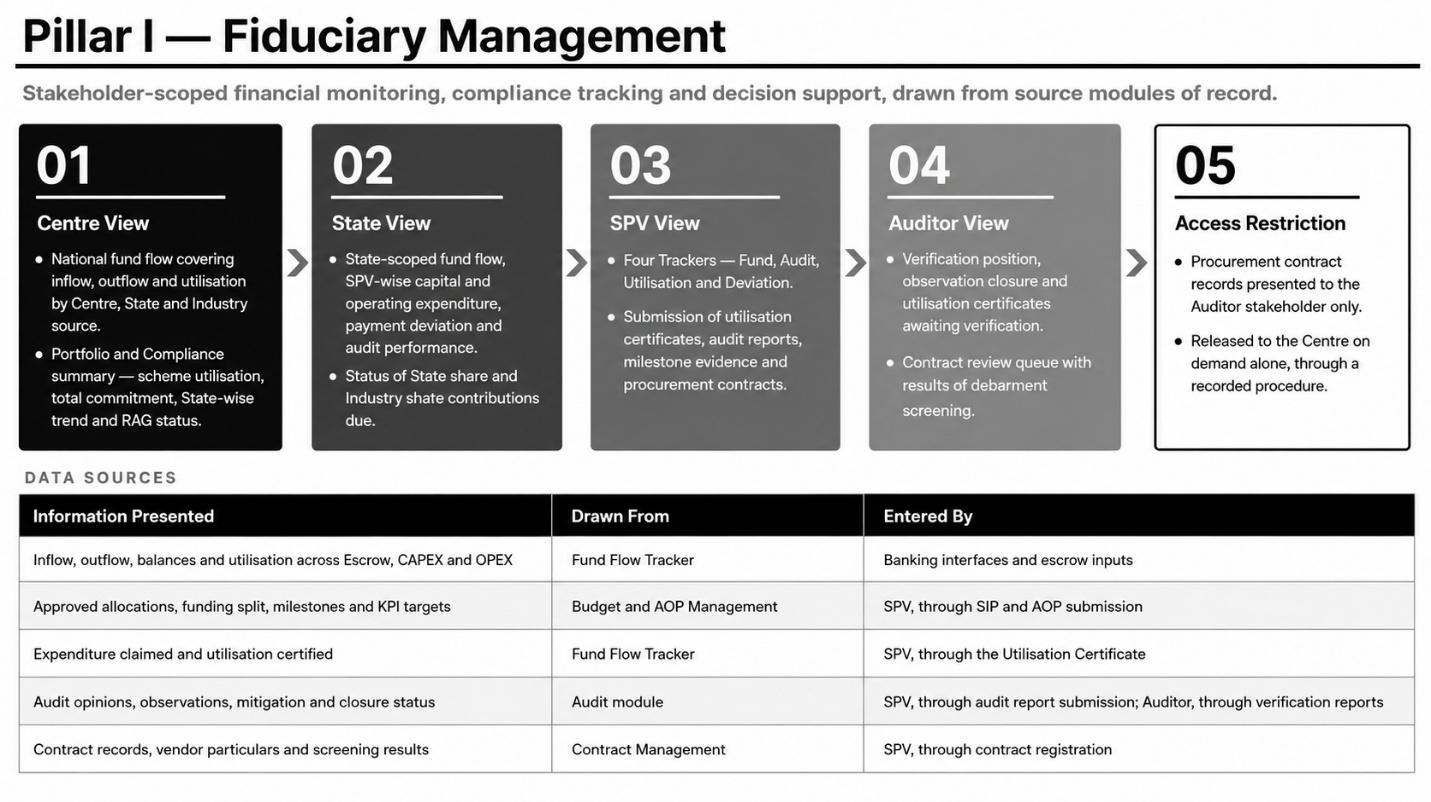
3.1. Pillar 1: Fiduciary Management Pillar
No caption in source
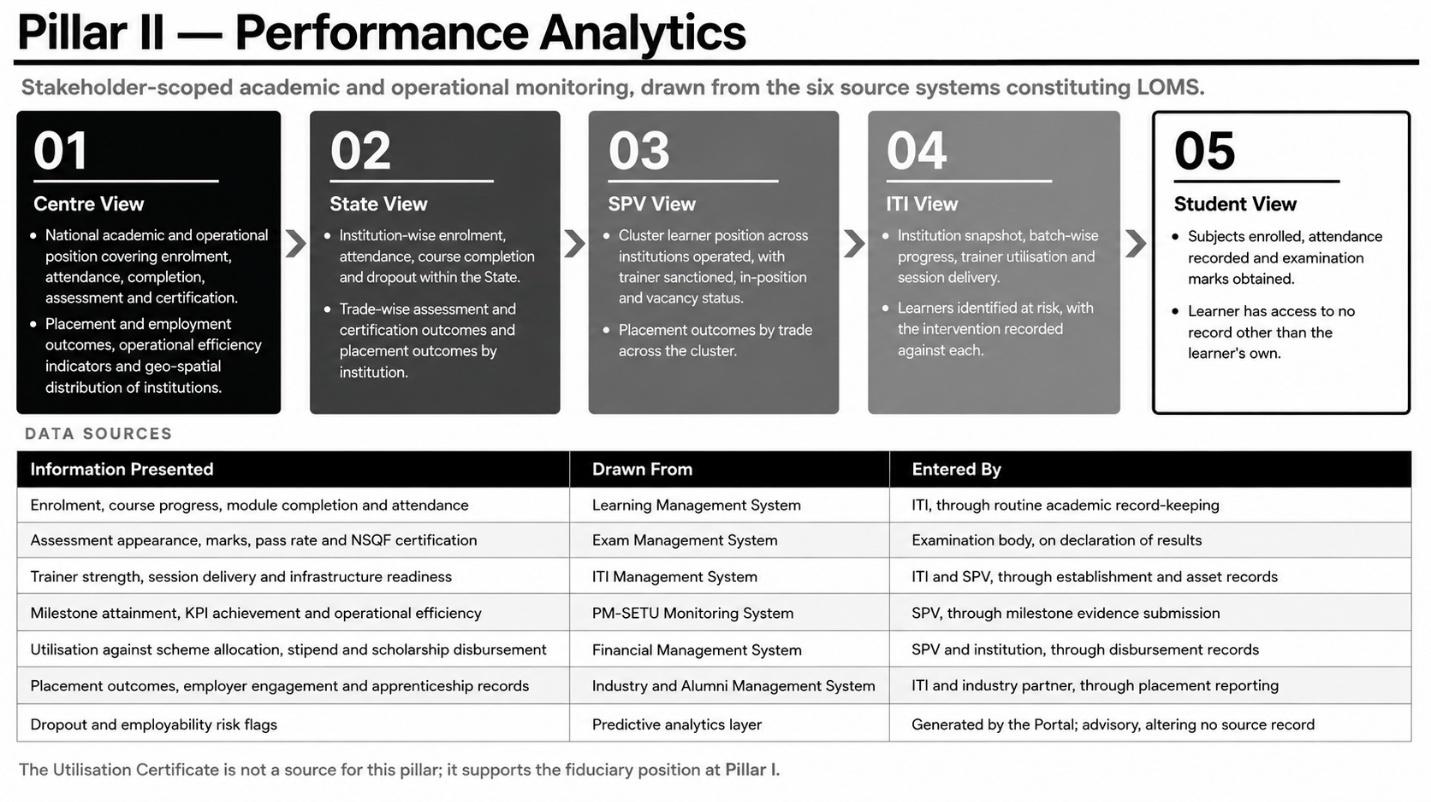
3.2. Pillar 2: Performance Analytics Pillar
No caption in source
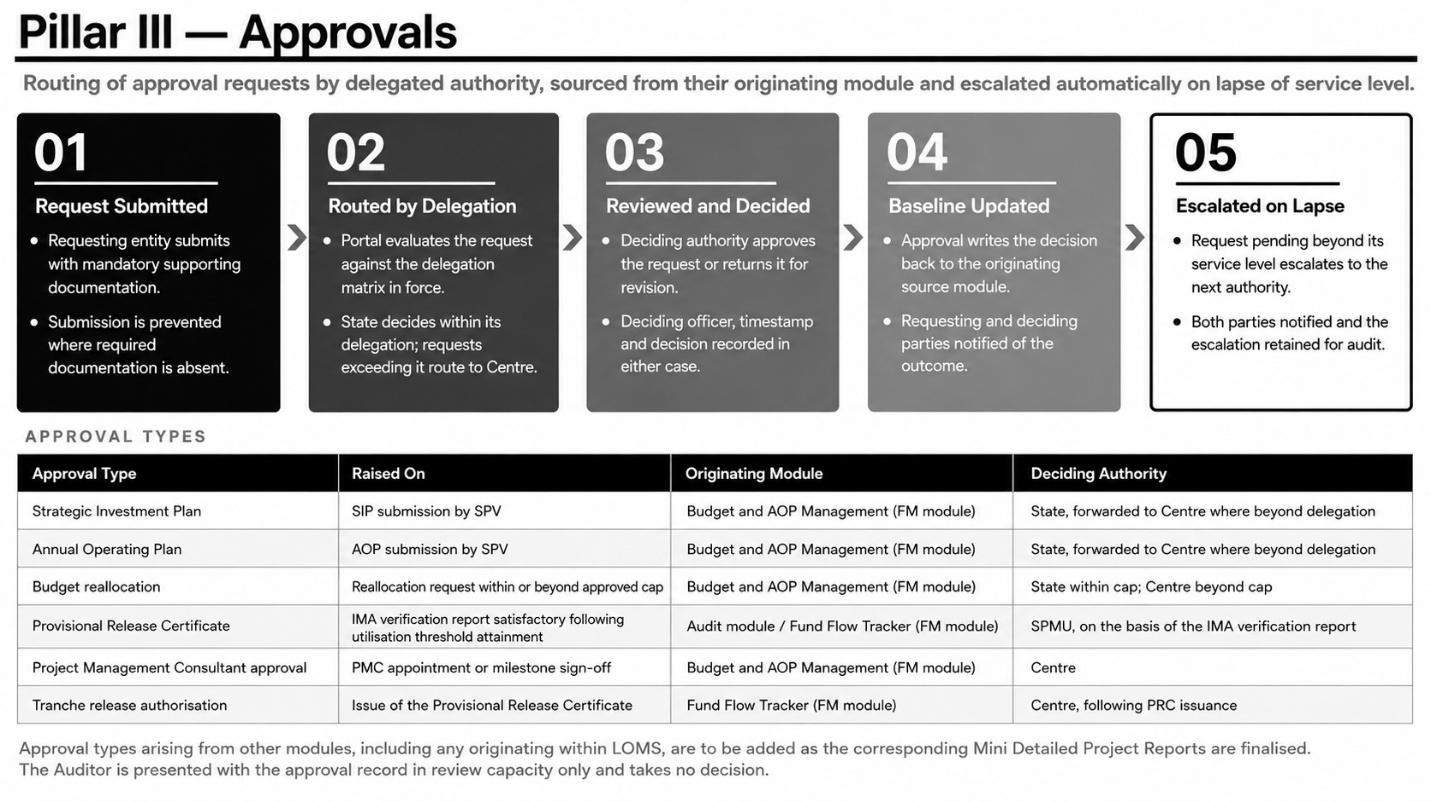
3.3. Pillar 3: Approvals Pillar
No caption in source
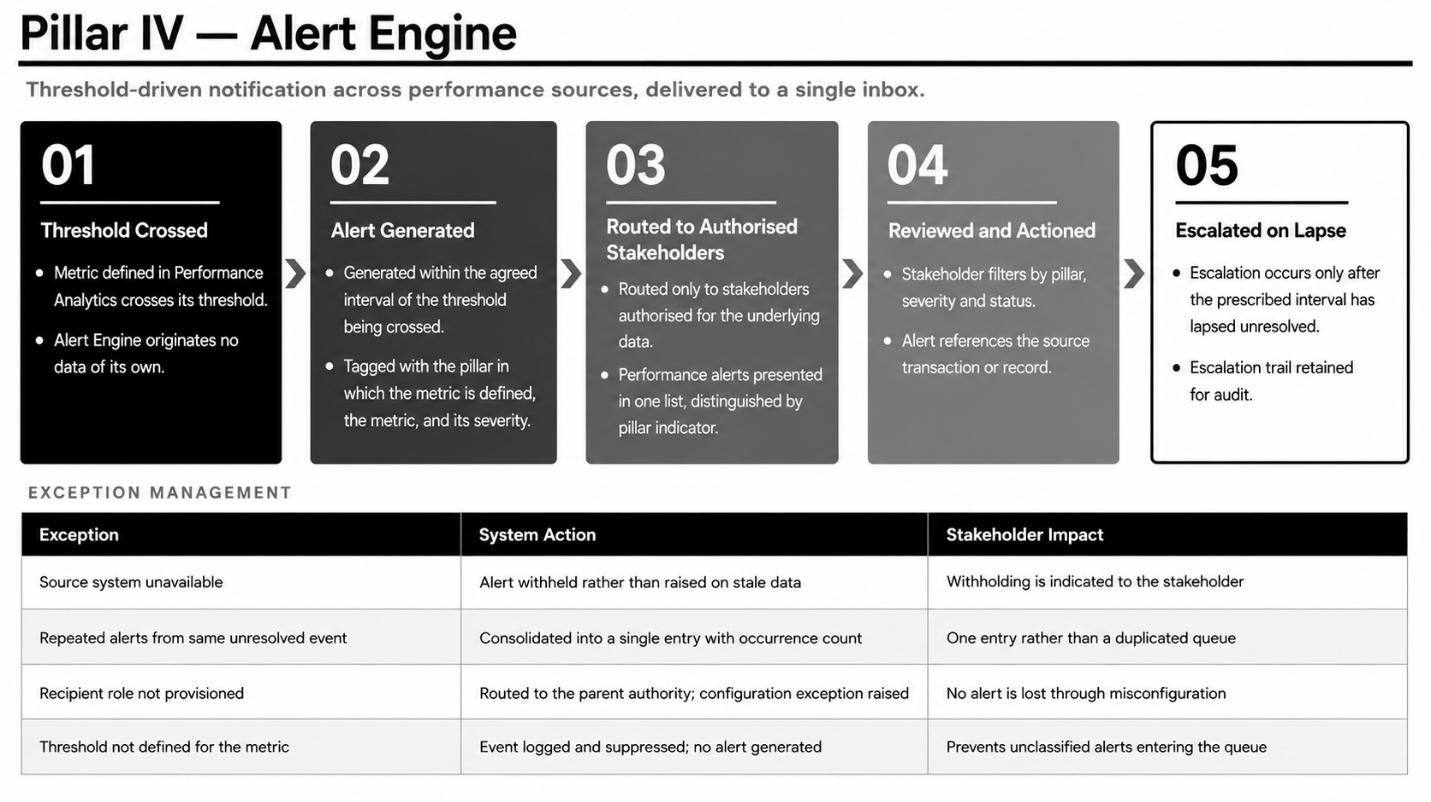
3.4. Pillar 4: Alert Engine Pillar
No caption in source
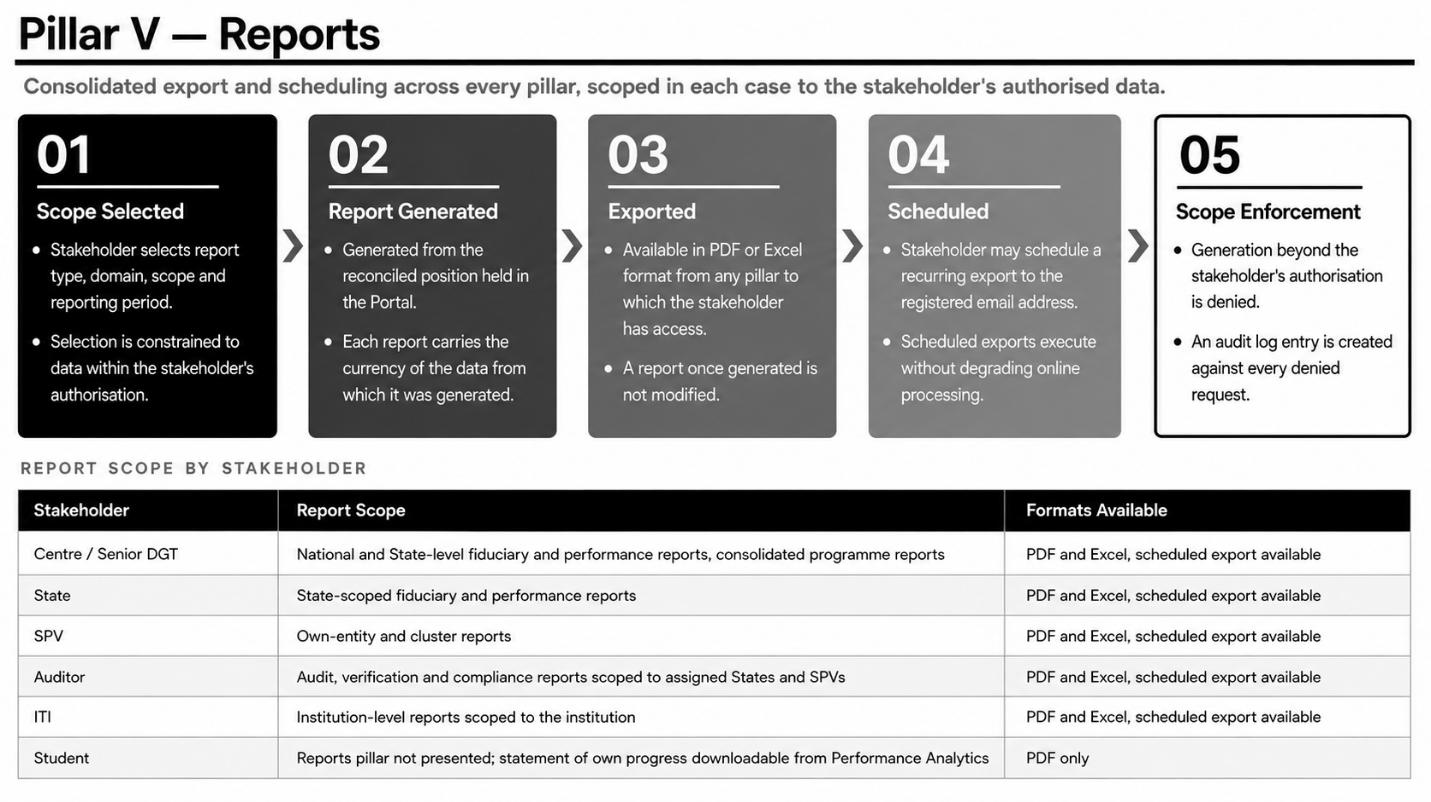
3.5. Pillar 5: Reports Pillar
No caption in source
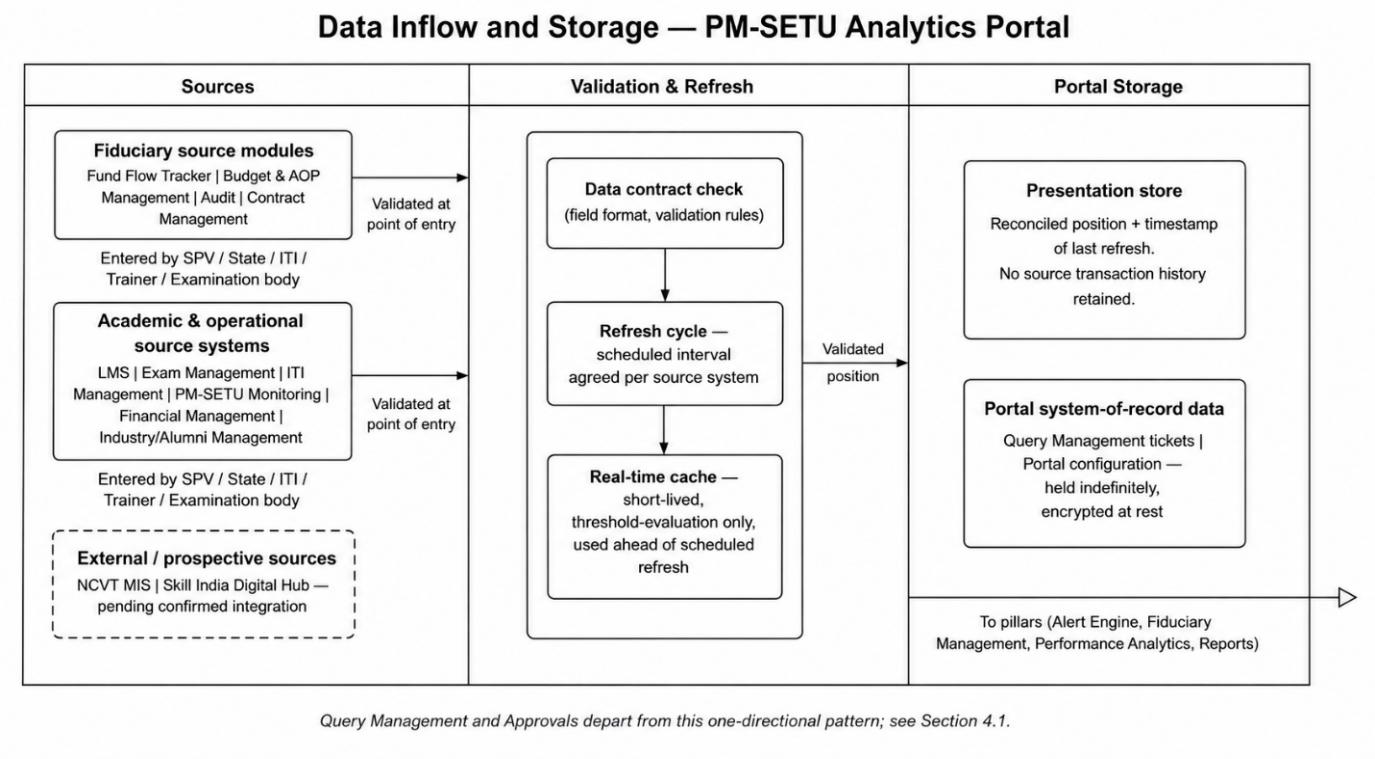
4.1.1 Sources of Inflow
No caption in source
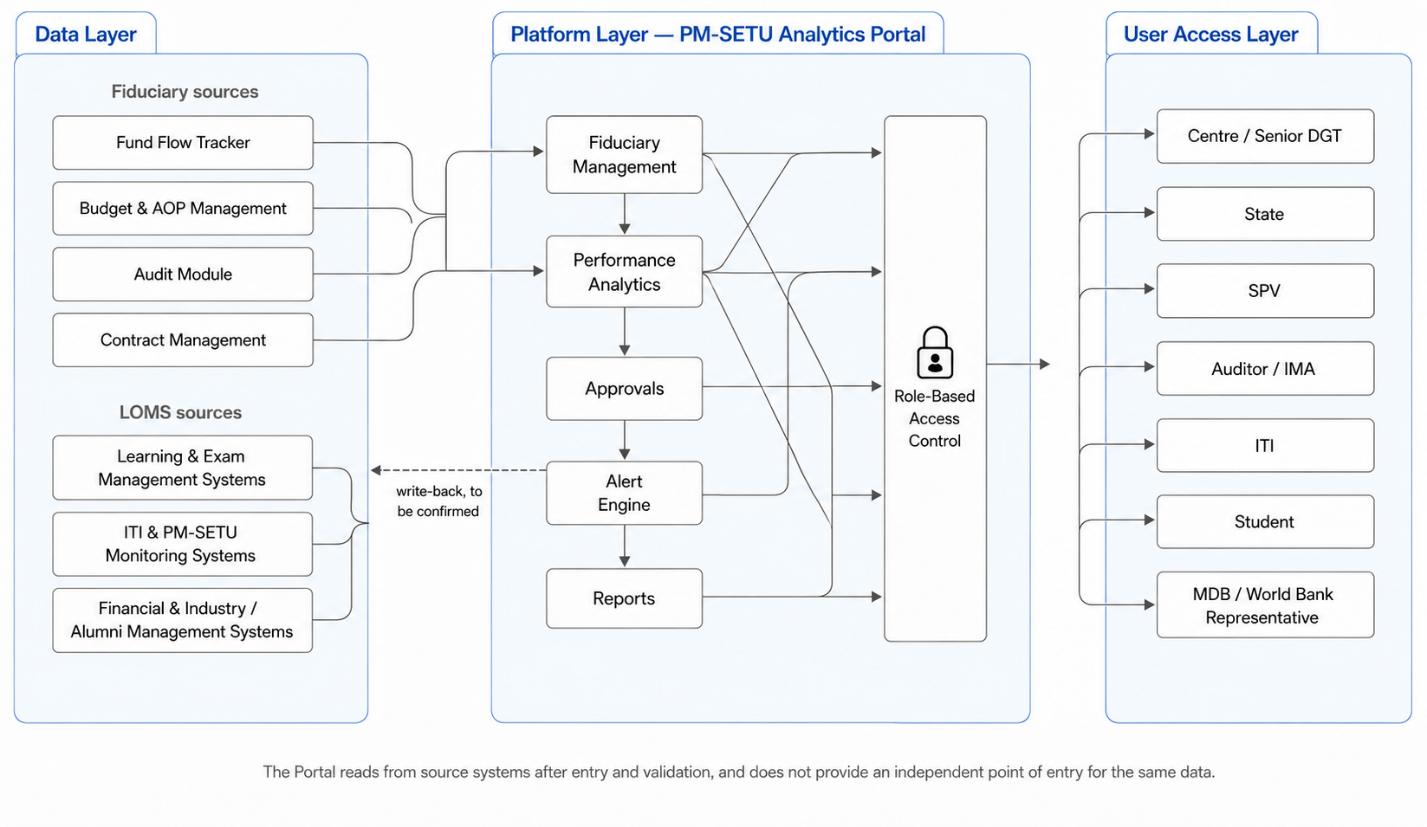
4.3. User Access Layer
No caption in source
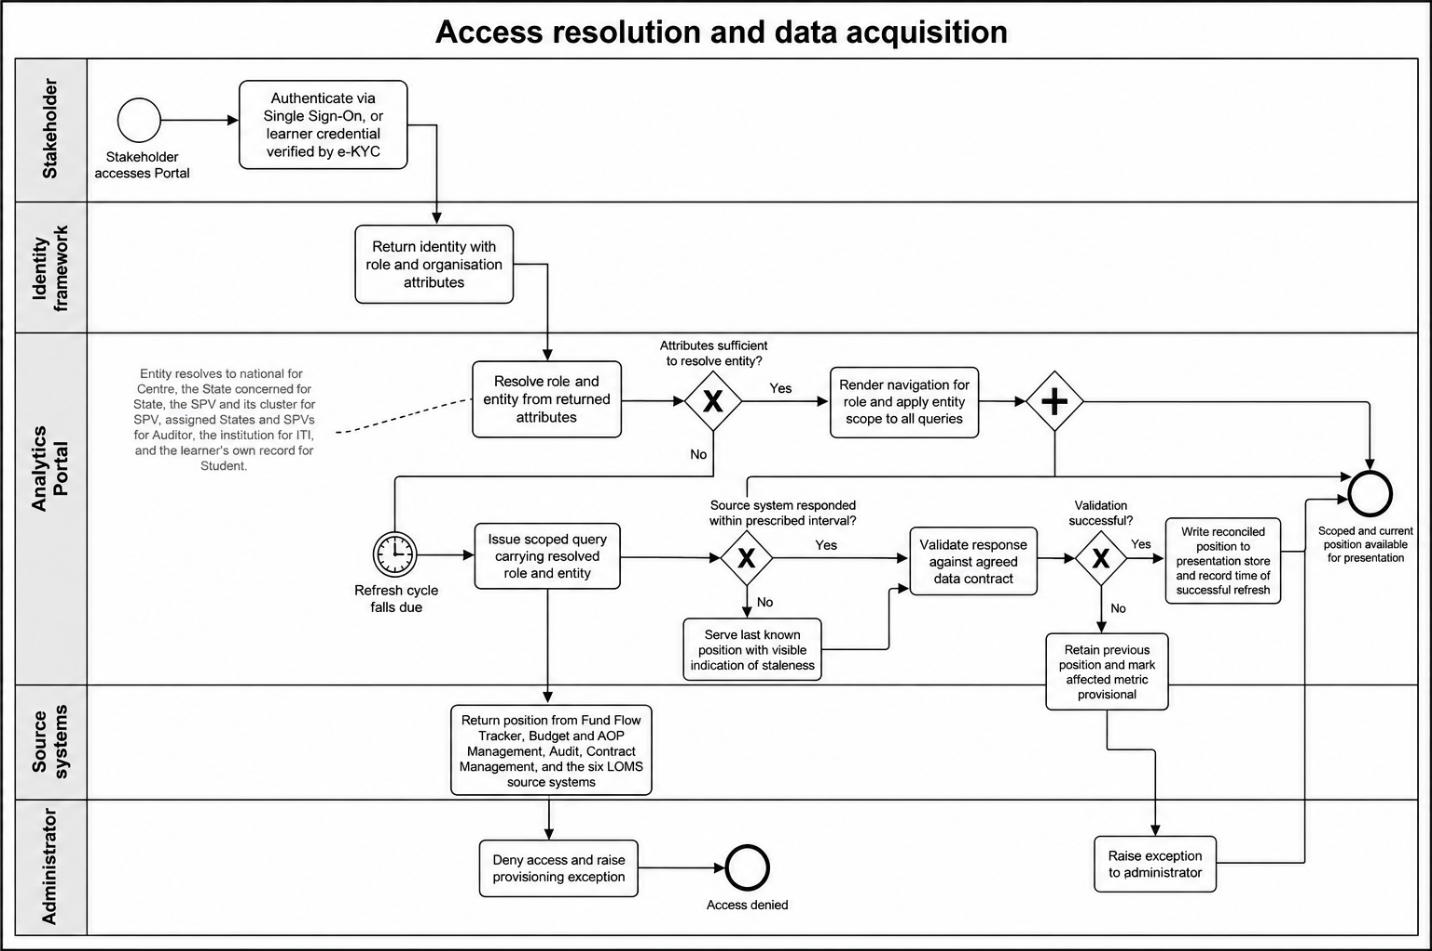
7.1. Access and data acquisition process design
No caption in source
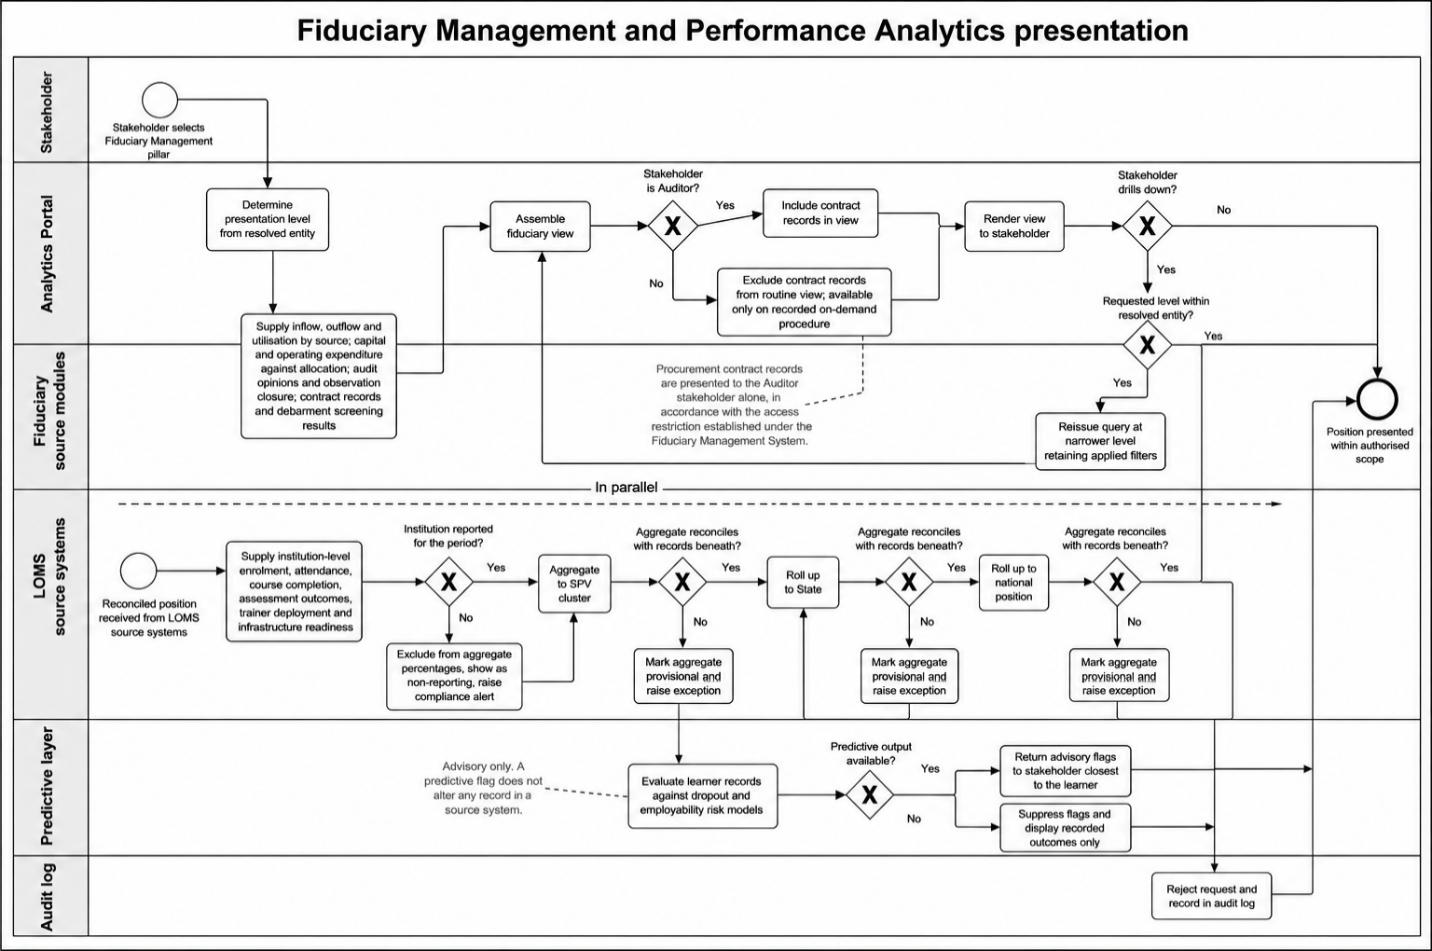
7.2. Fiduciary and performance presentation process design
No caption in source
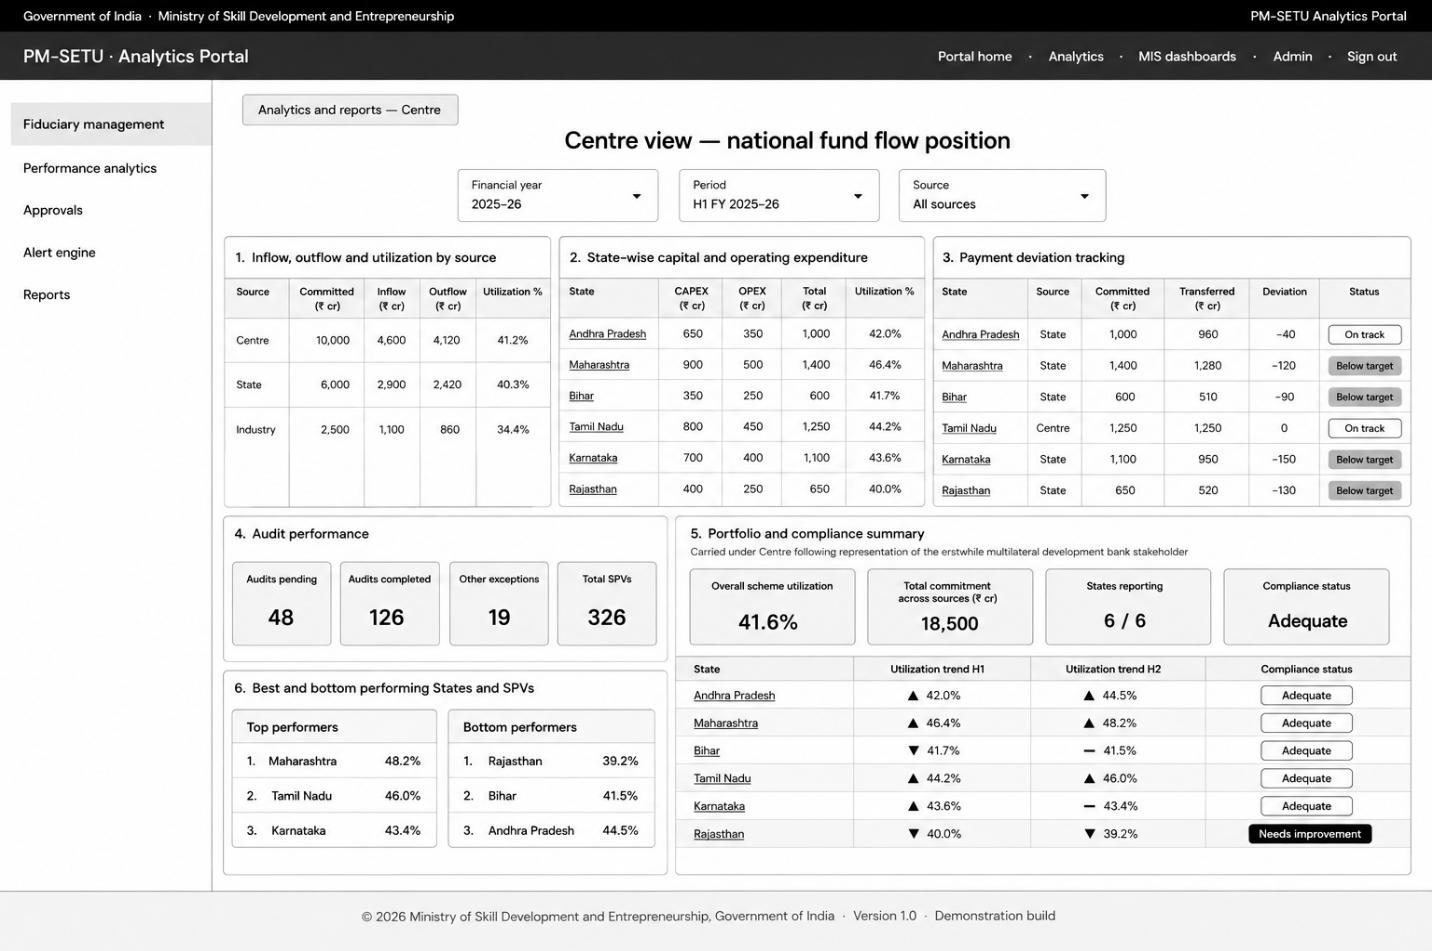
7.2. Fiduciary and performance presentation process design
No caption in source
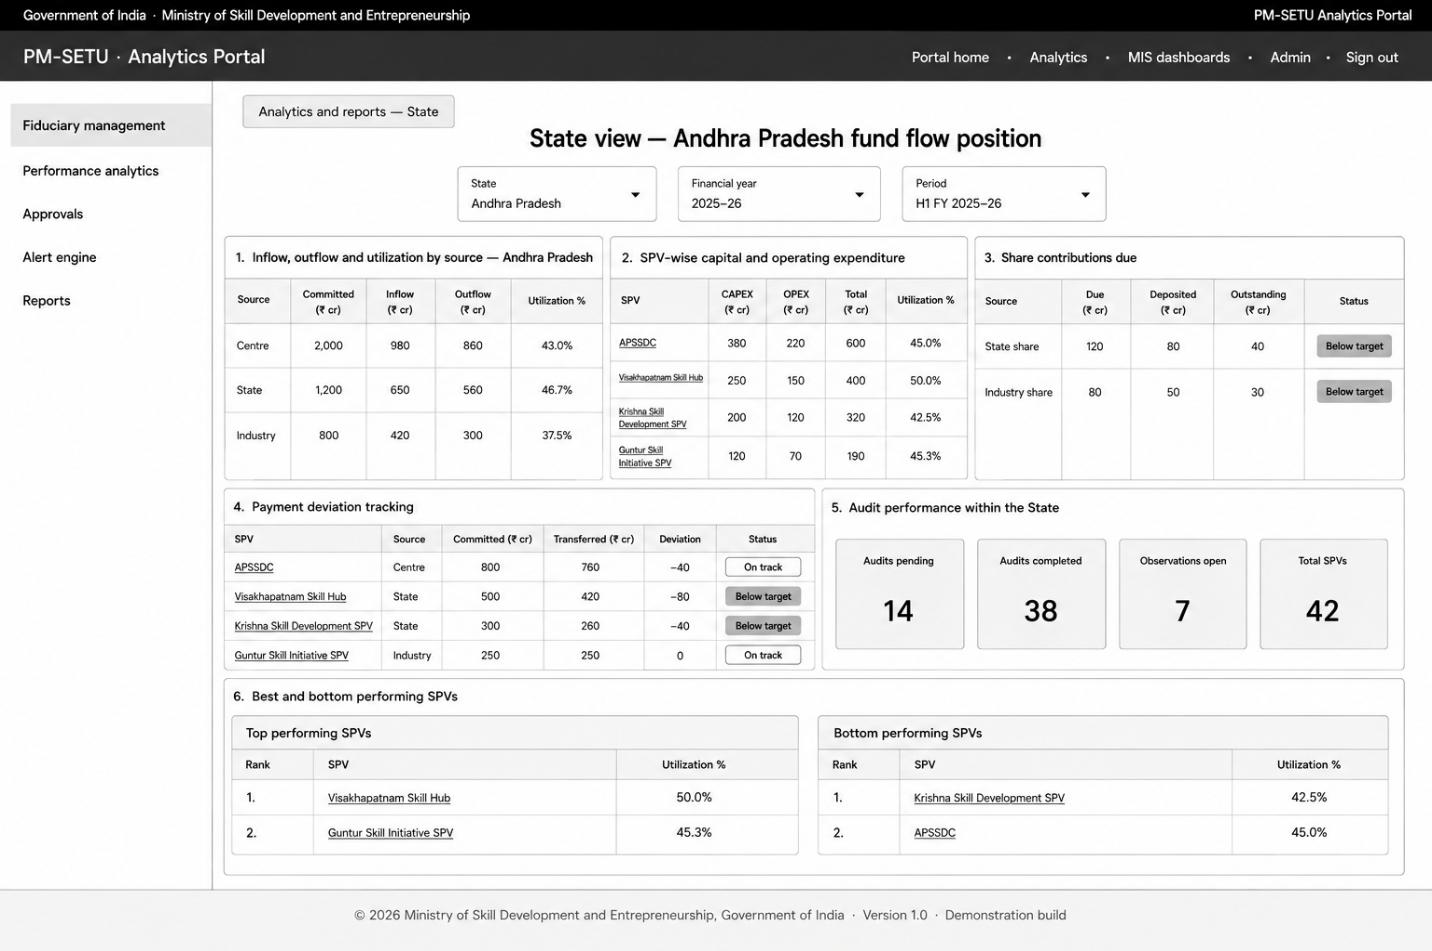
7.2. Fiduciary and performance presentation process design
No caption in source
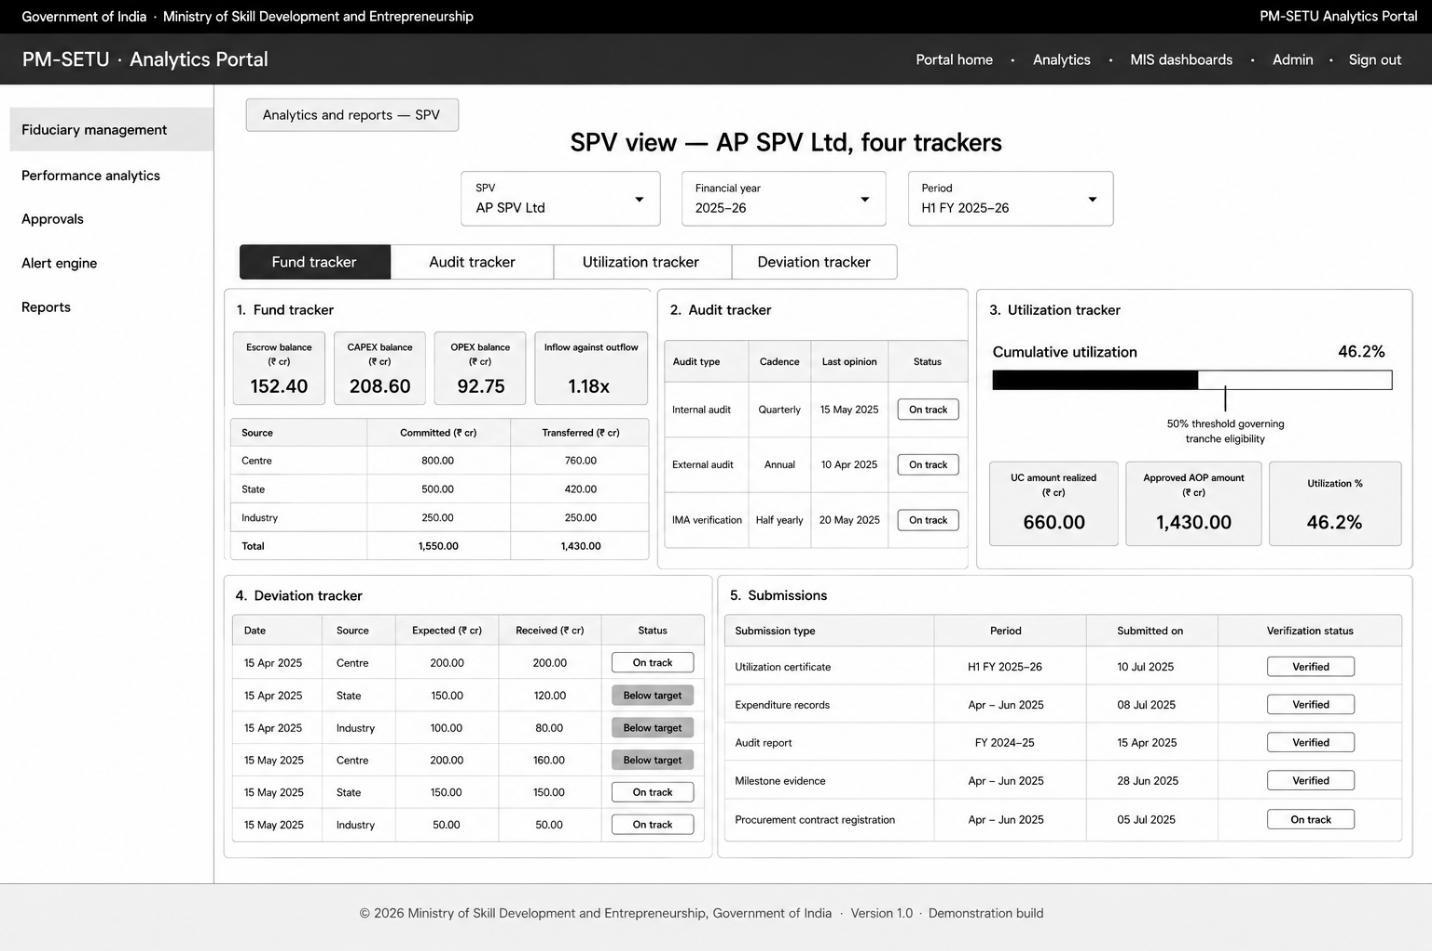
7.2. Fiduciary and performance presentation process design
No caption in source
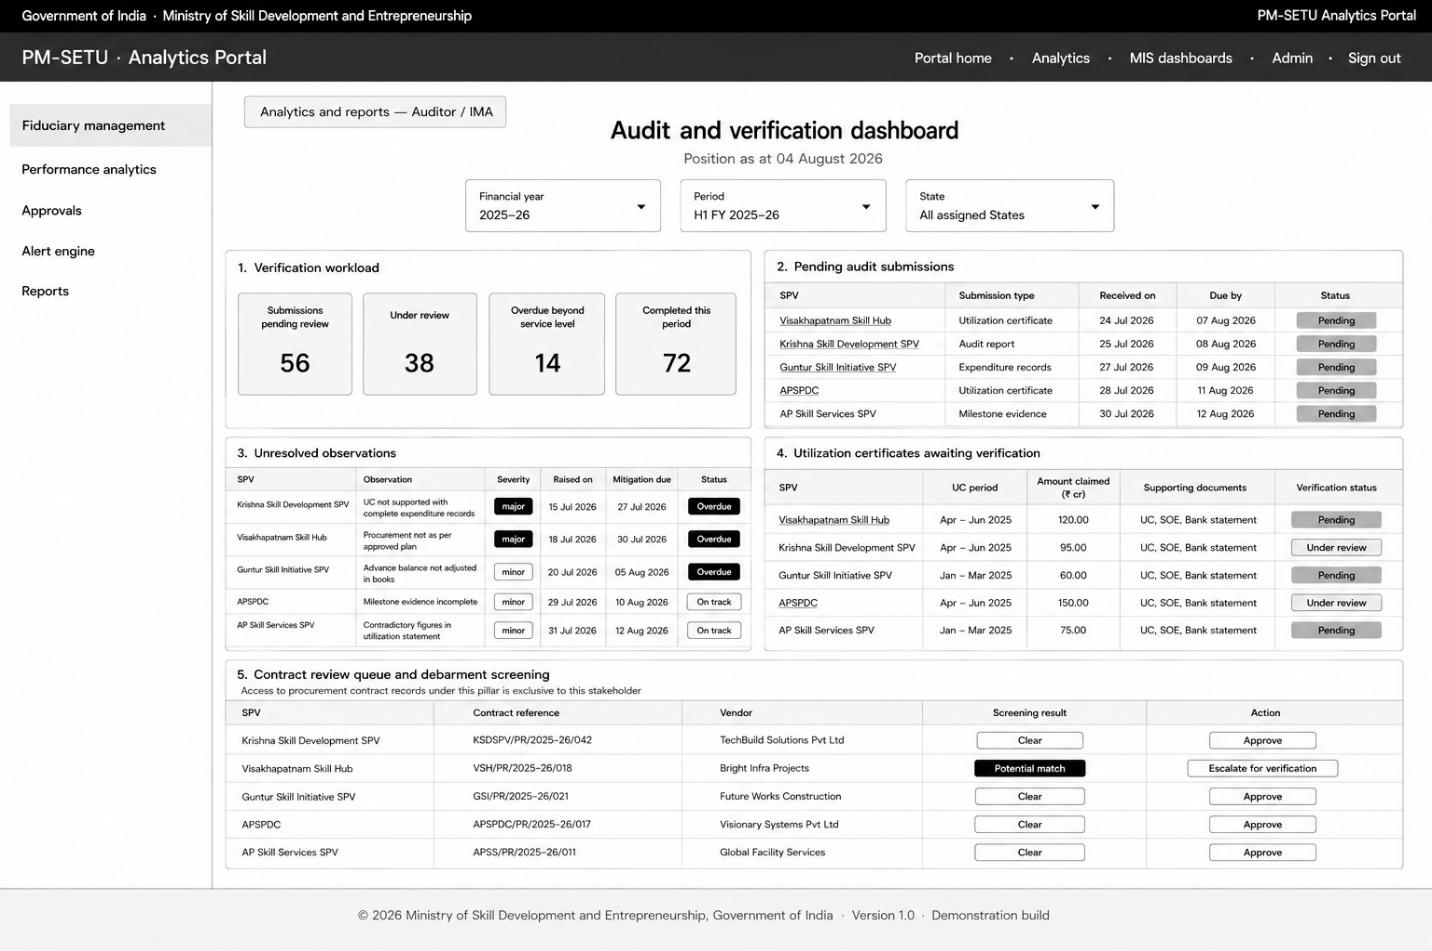
7.2. Fiduciary and performance presentation process design
No caption in source
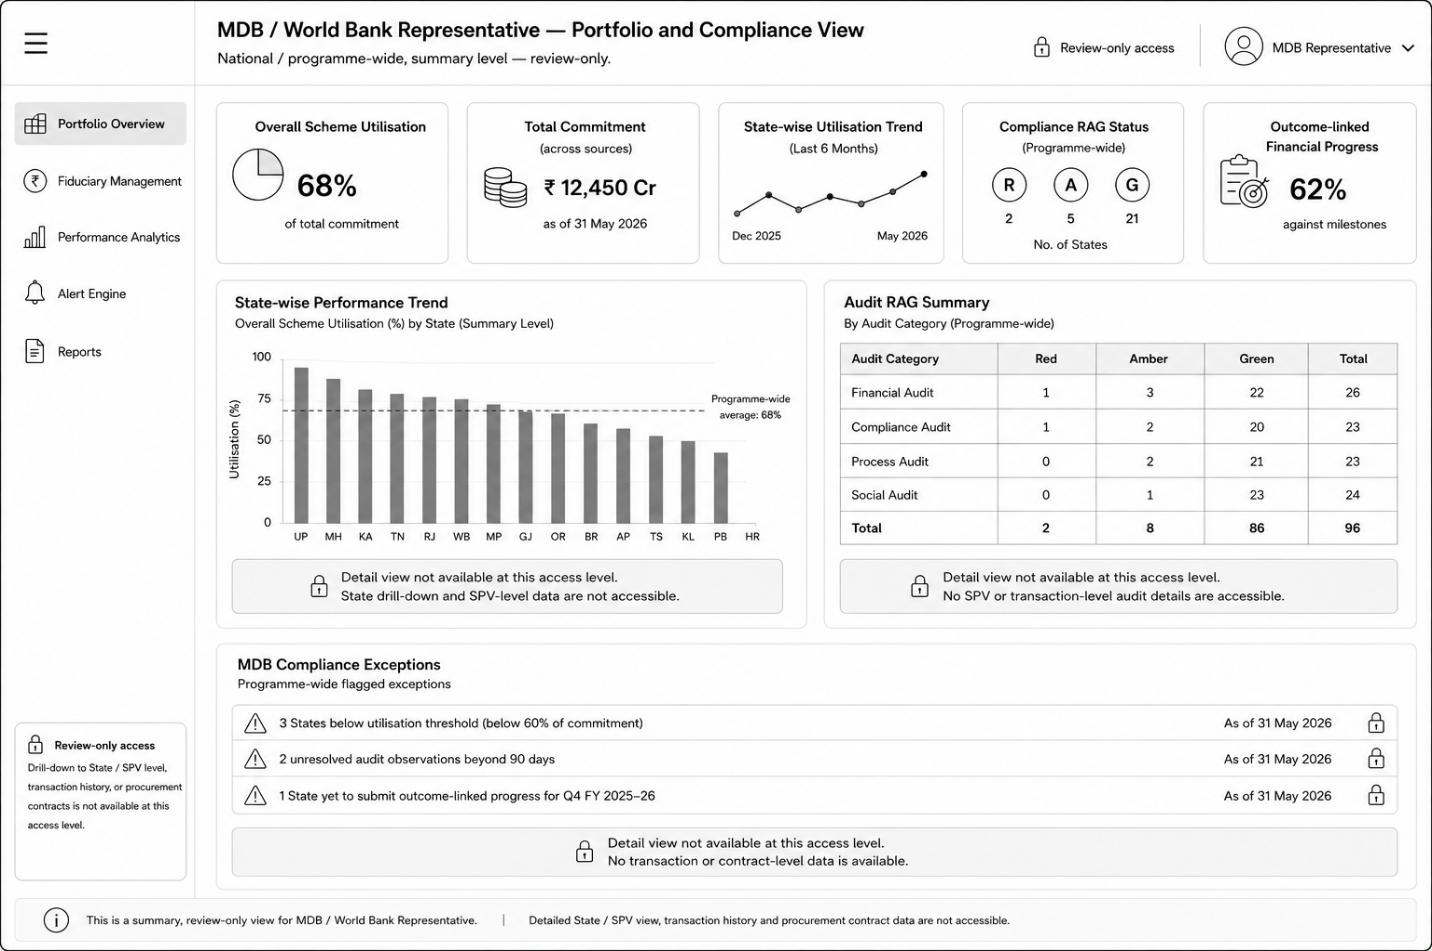
7.2. Fiduciary and performance presentation process design
No caption in source
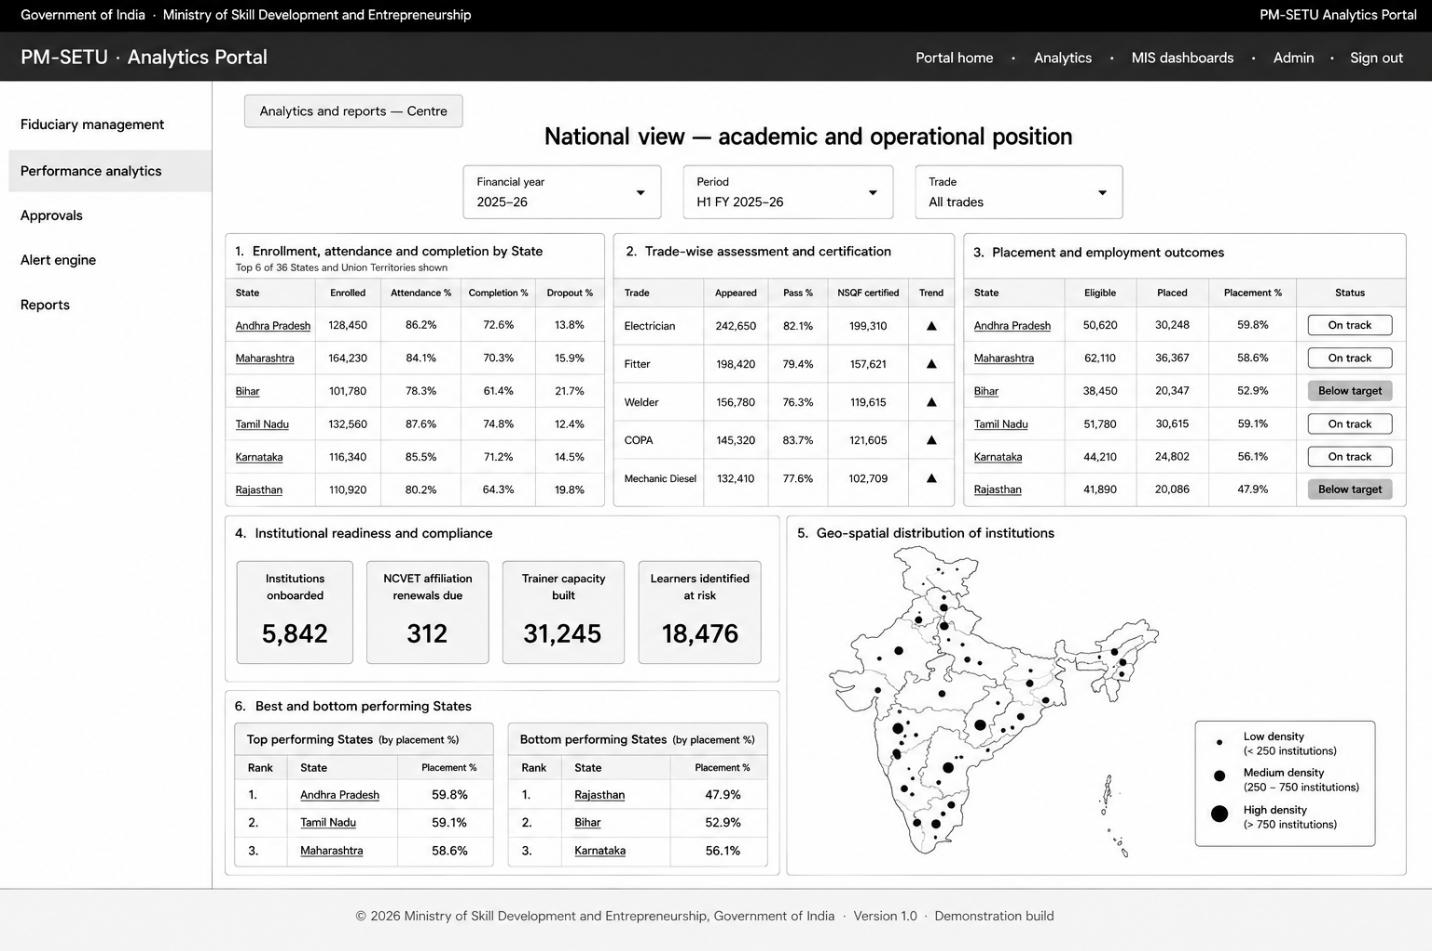
7.2. Fiduciary and performance presentation process design
No caption in source
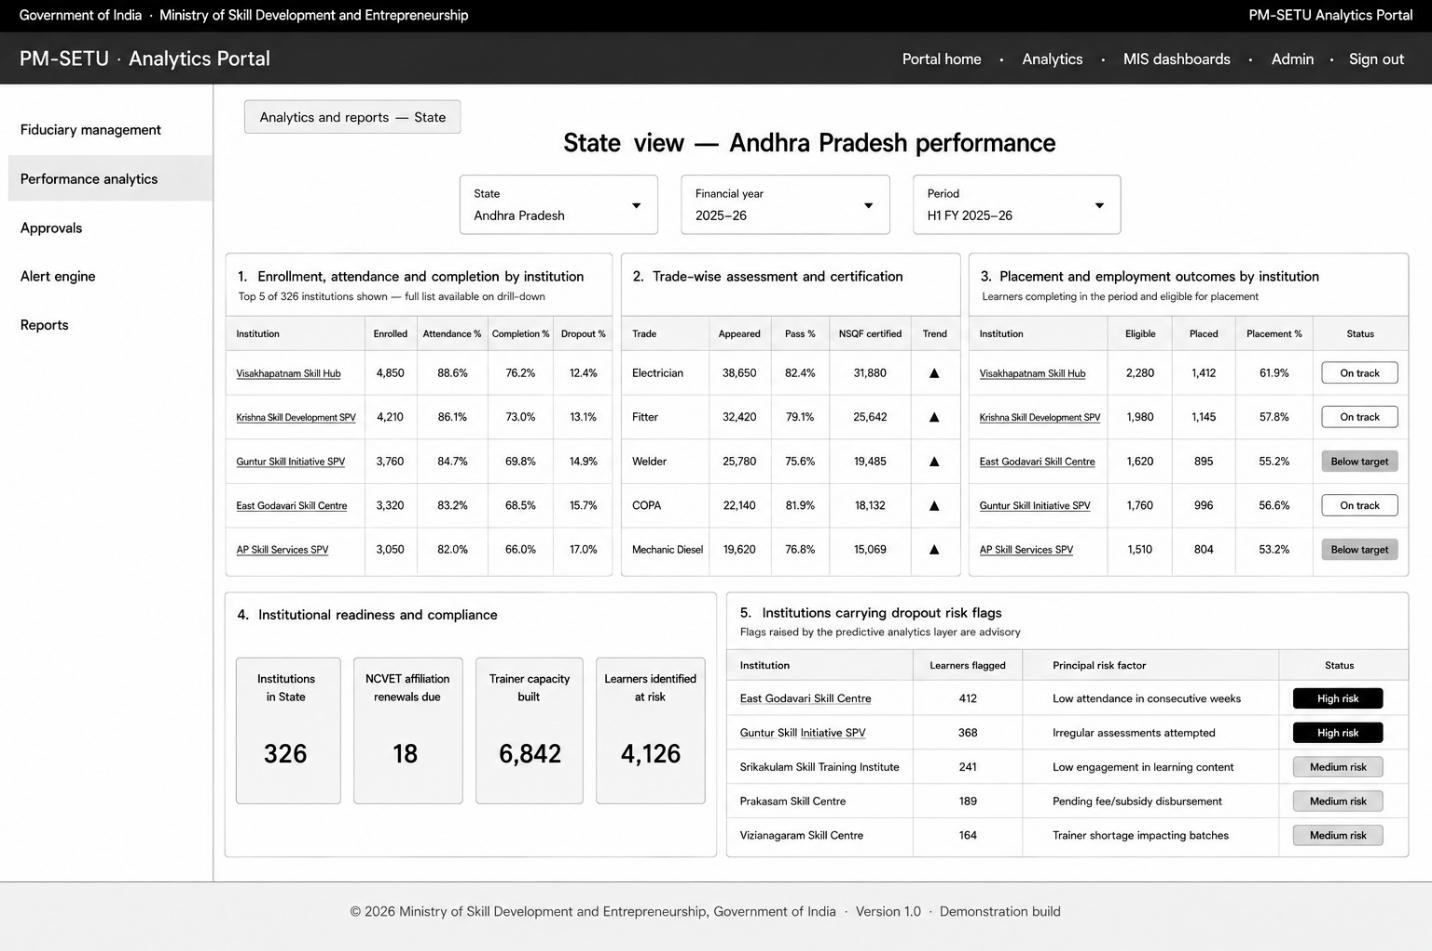
7.2. Fiduciary and performance presentation process design
No caption in source
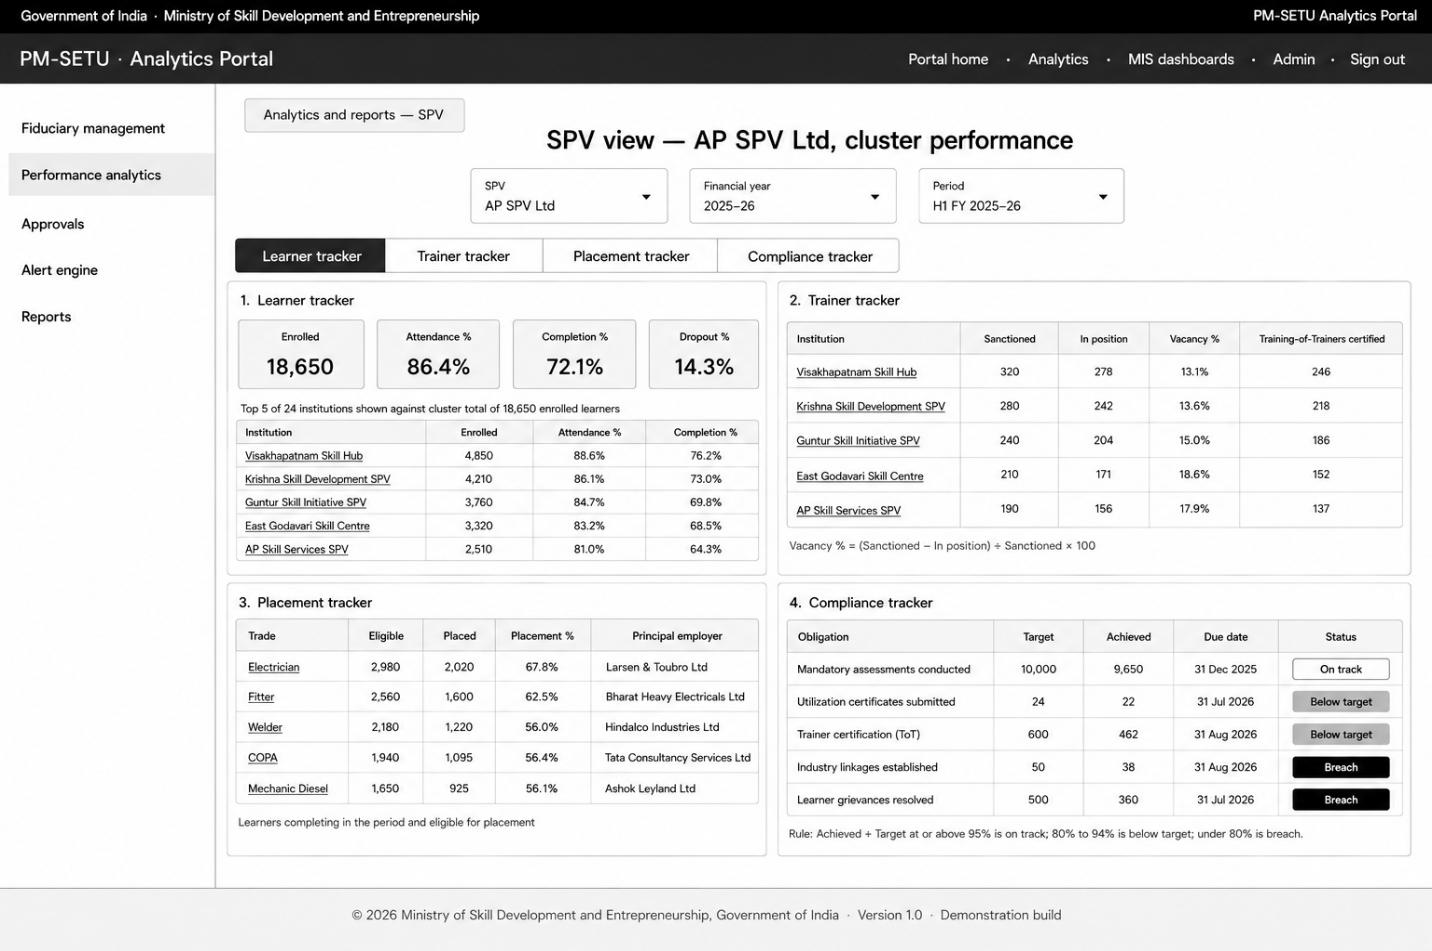
7.2. Fiduciary and performance presentation process design
No caption in source
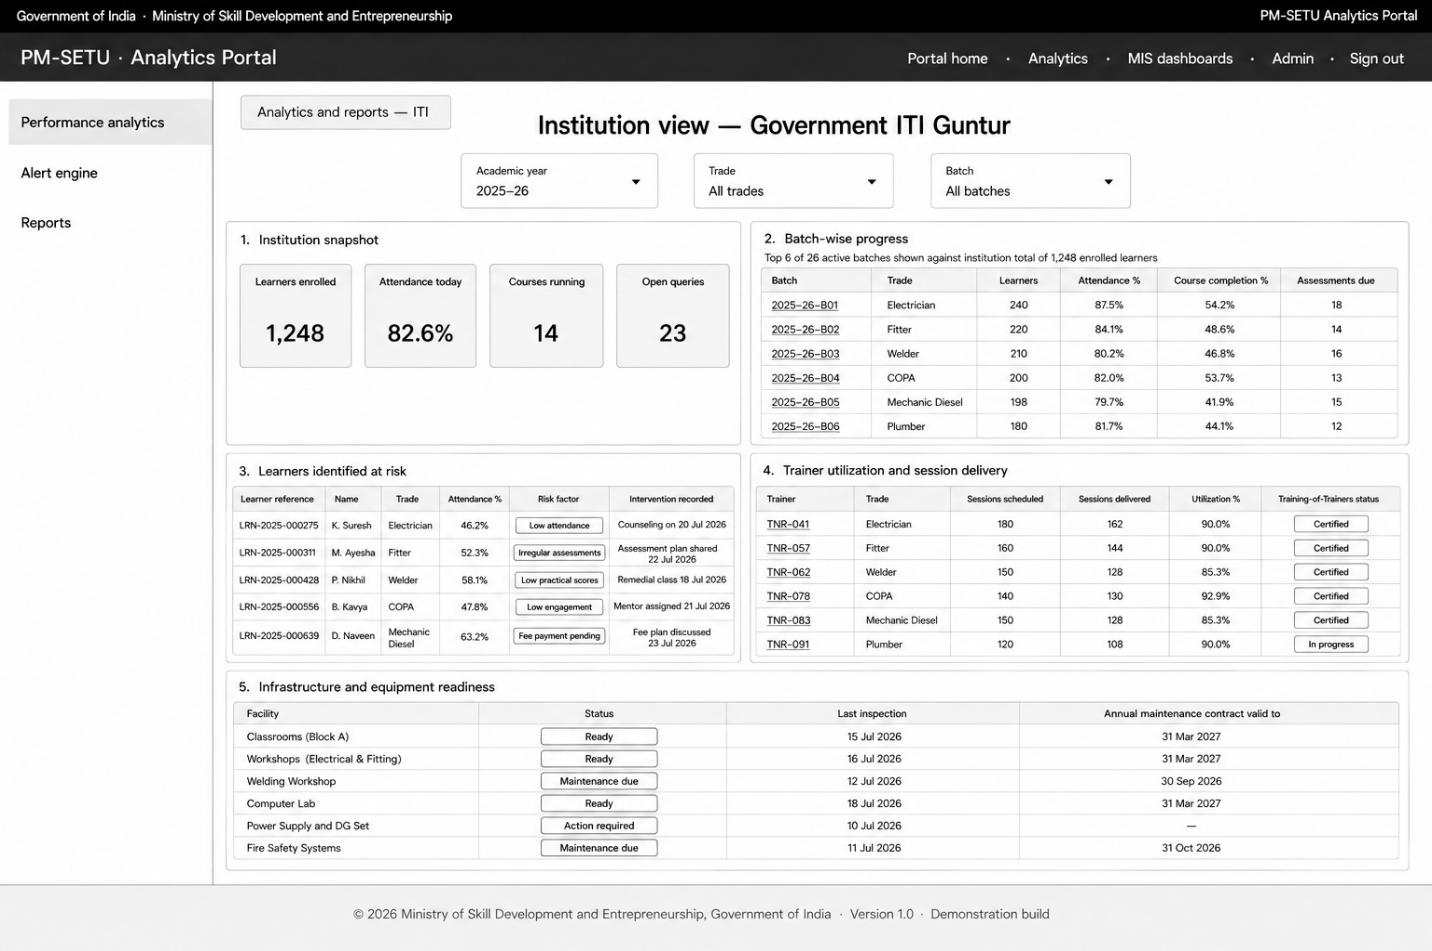
7.2. Fiduciary and performance presentation process design
No caption in source
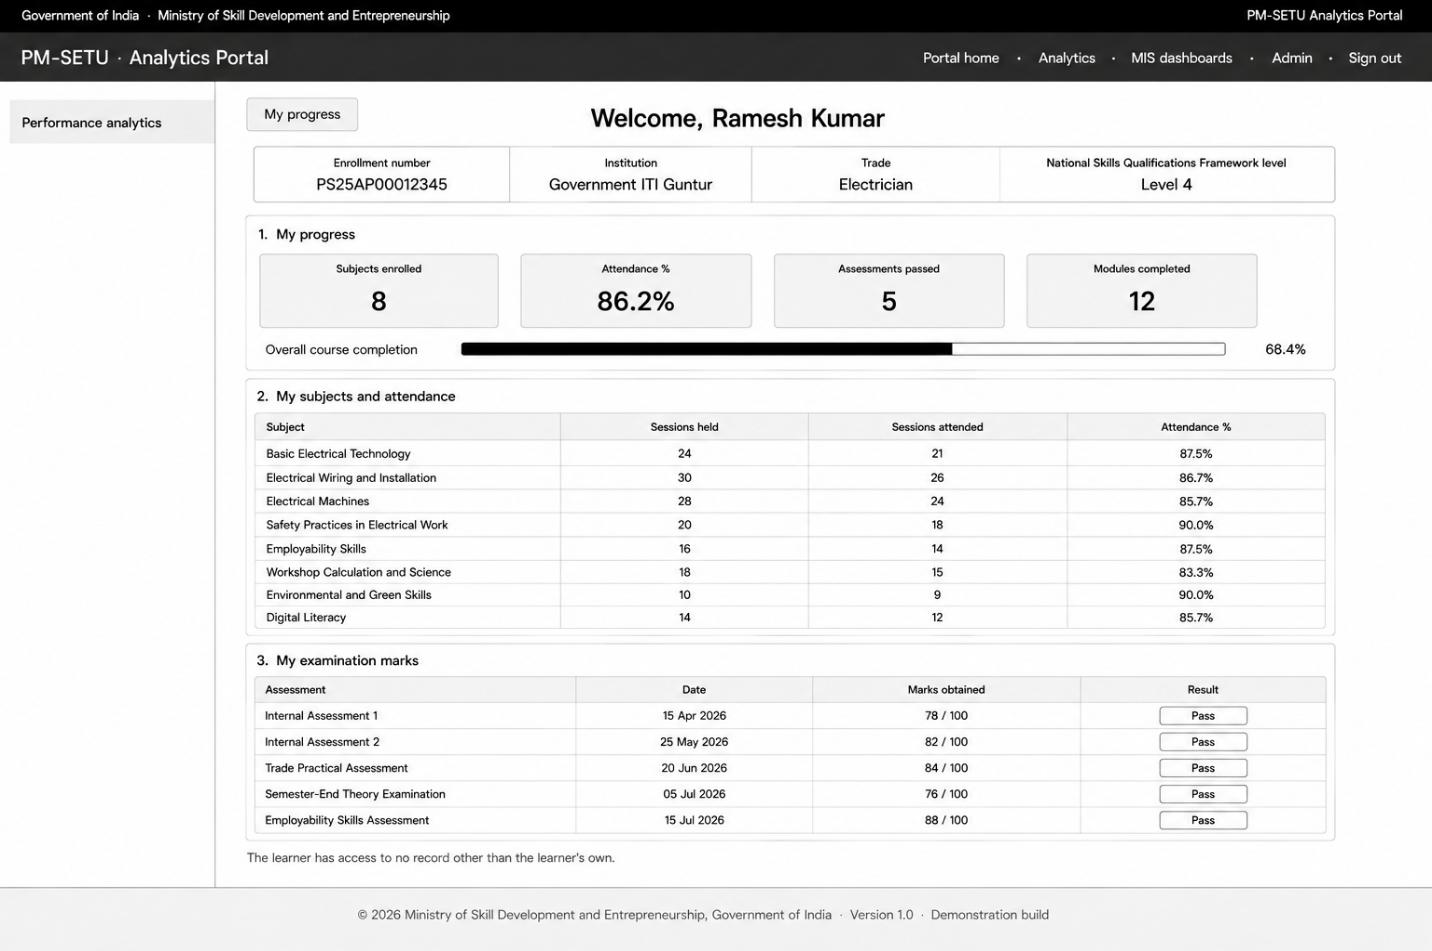
7.2. Fiduciary and performance presentation process design
No caption in source
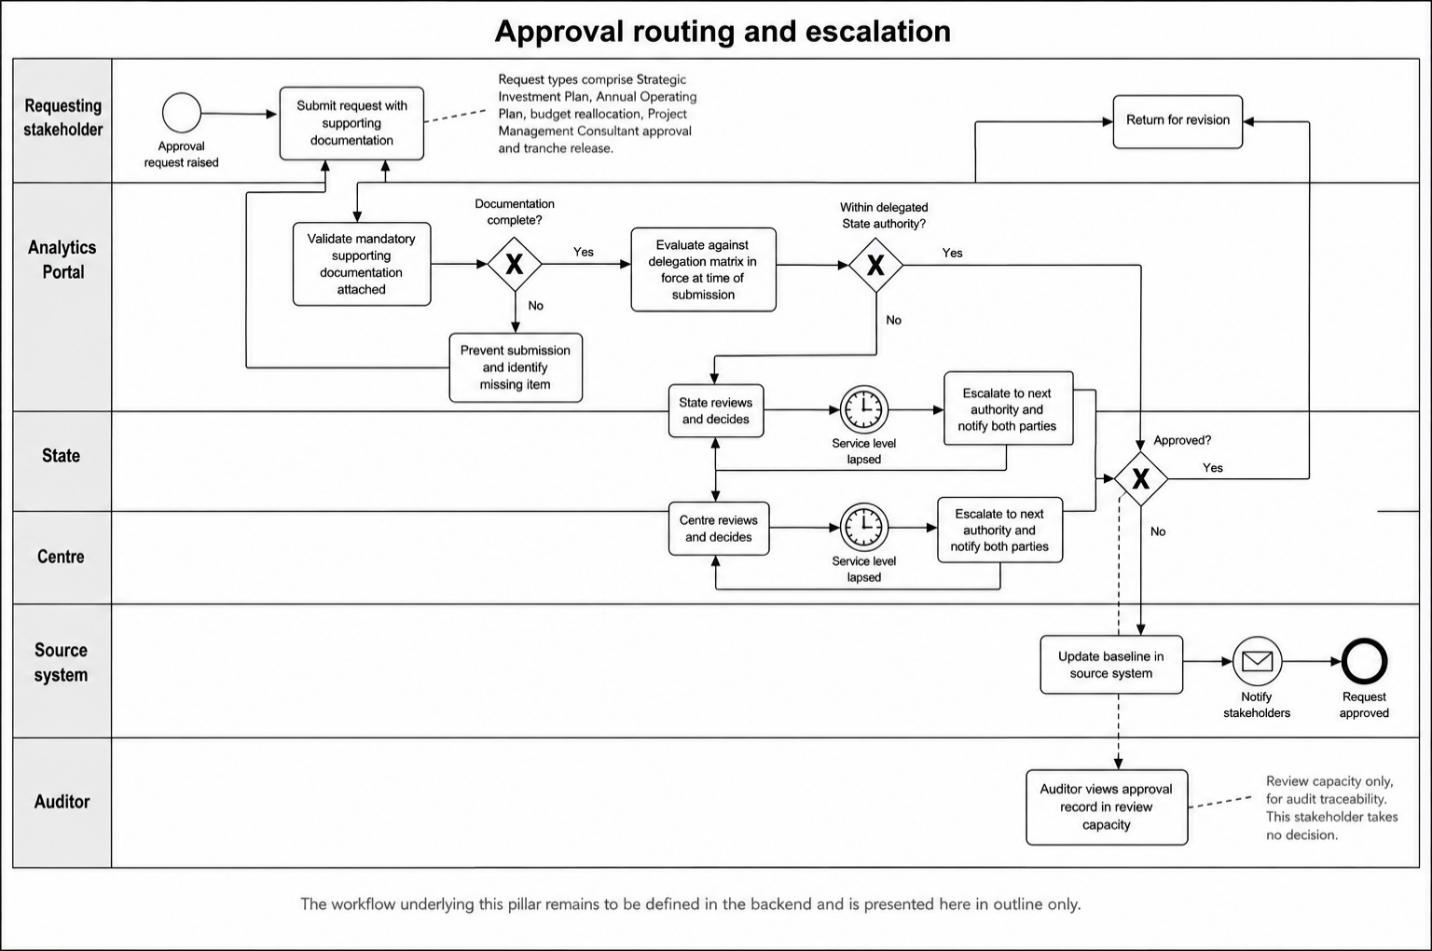
7.3. Approval routing process design
No caption in source
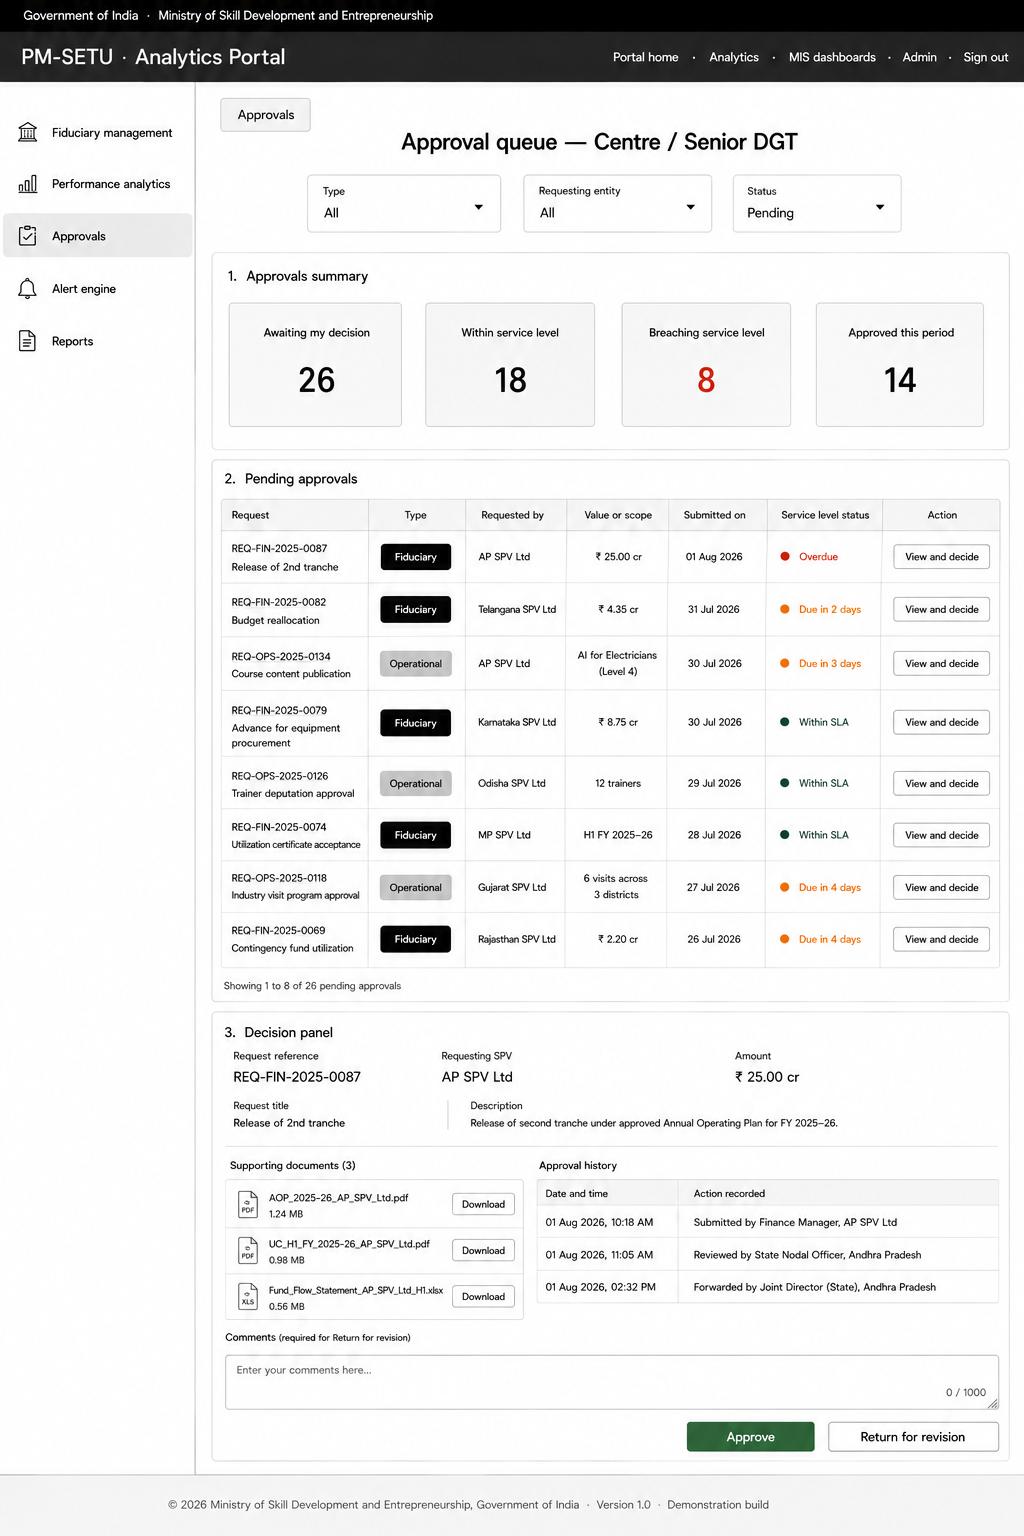
7.3. Approval routing process design
No caption in source
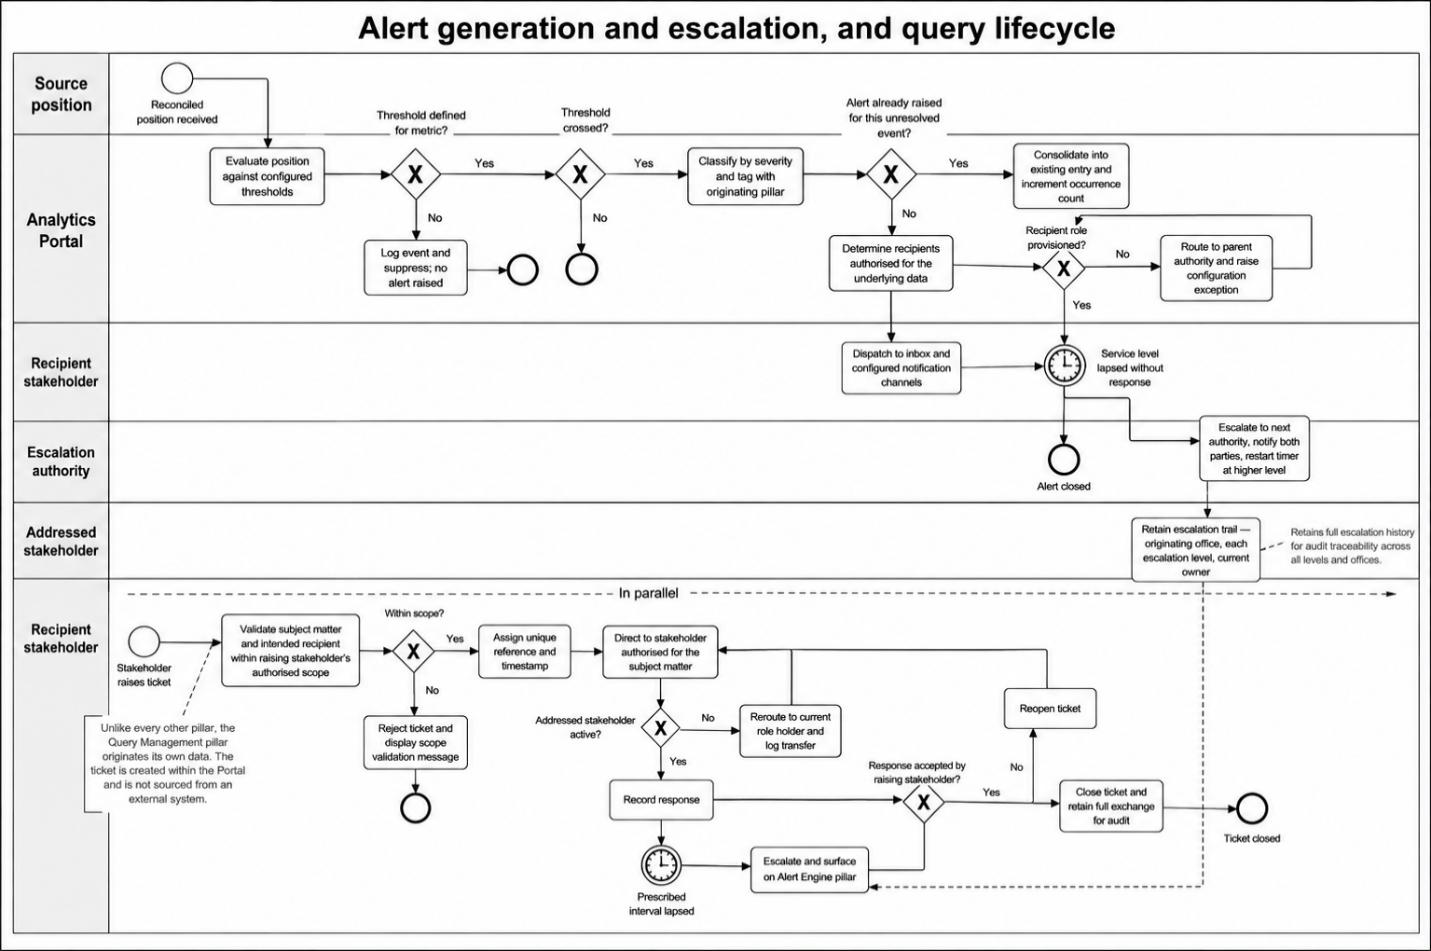
7.4. Alert Engine process design
No caption in source
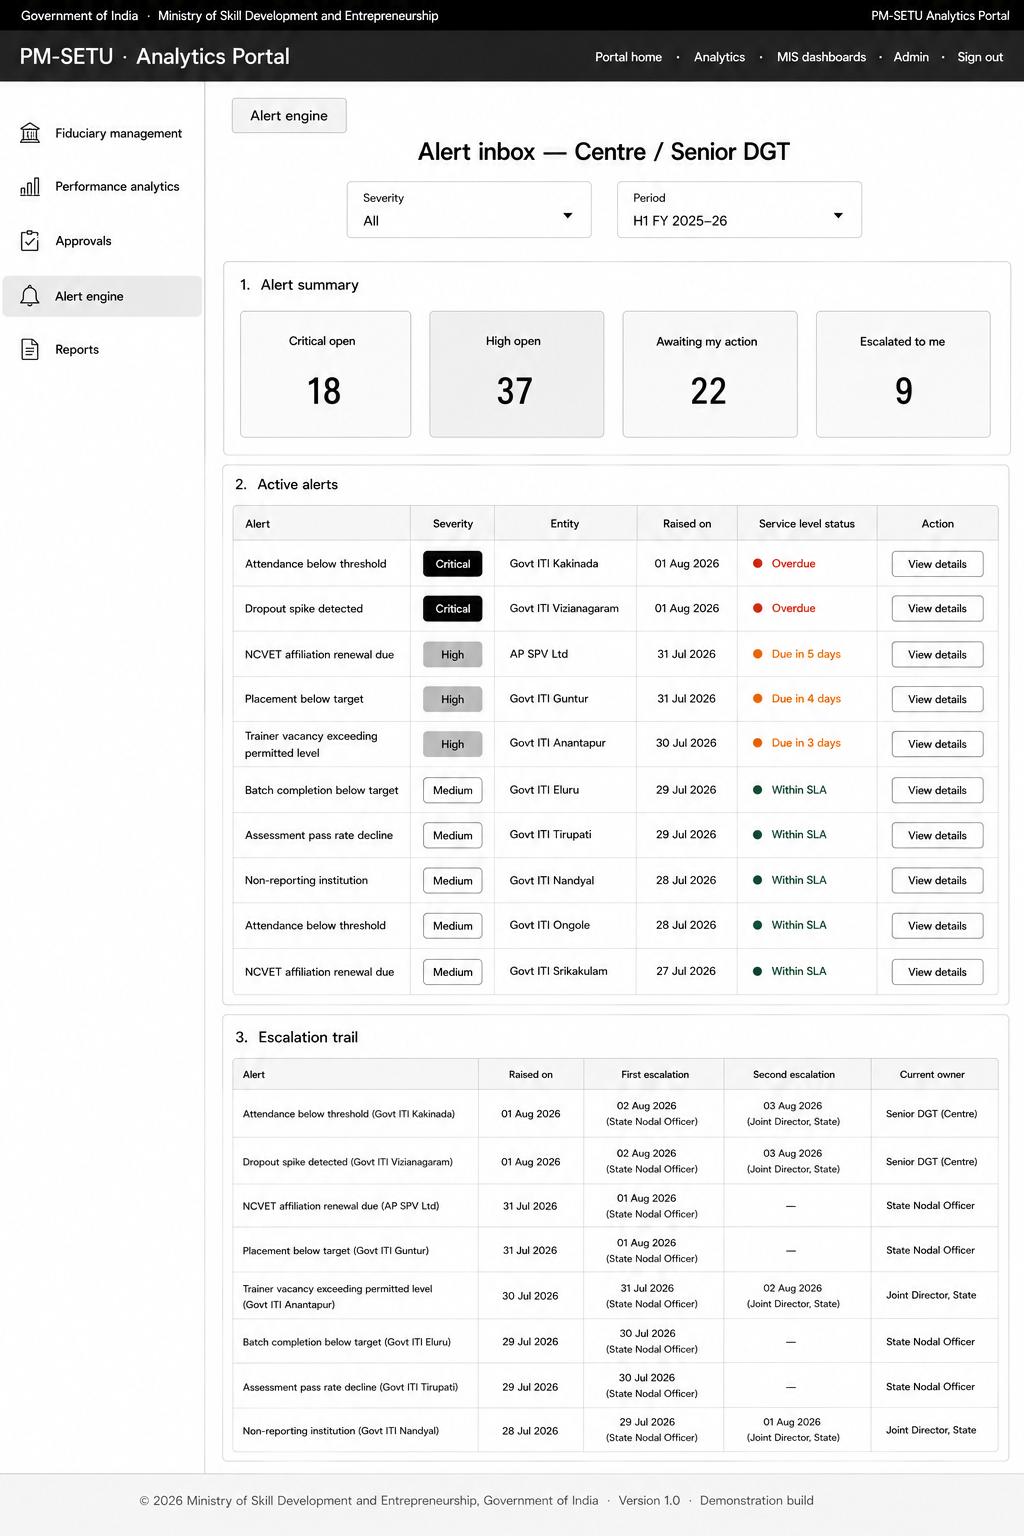
7.4. Alert Engine process design
No caption in source
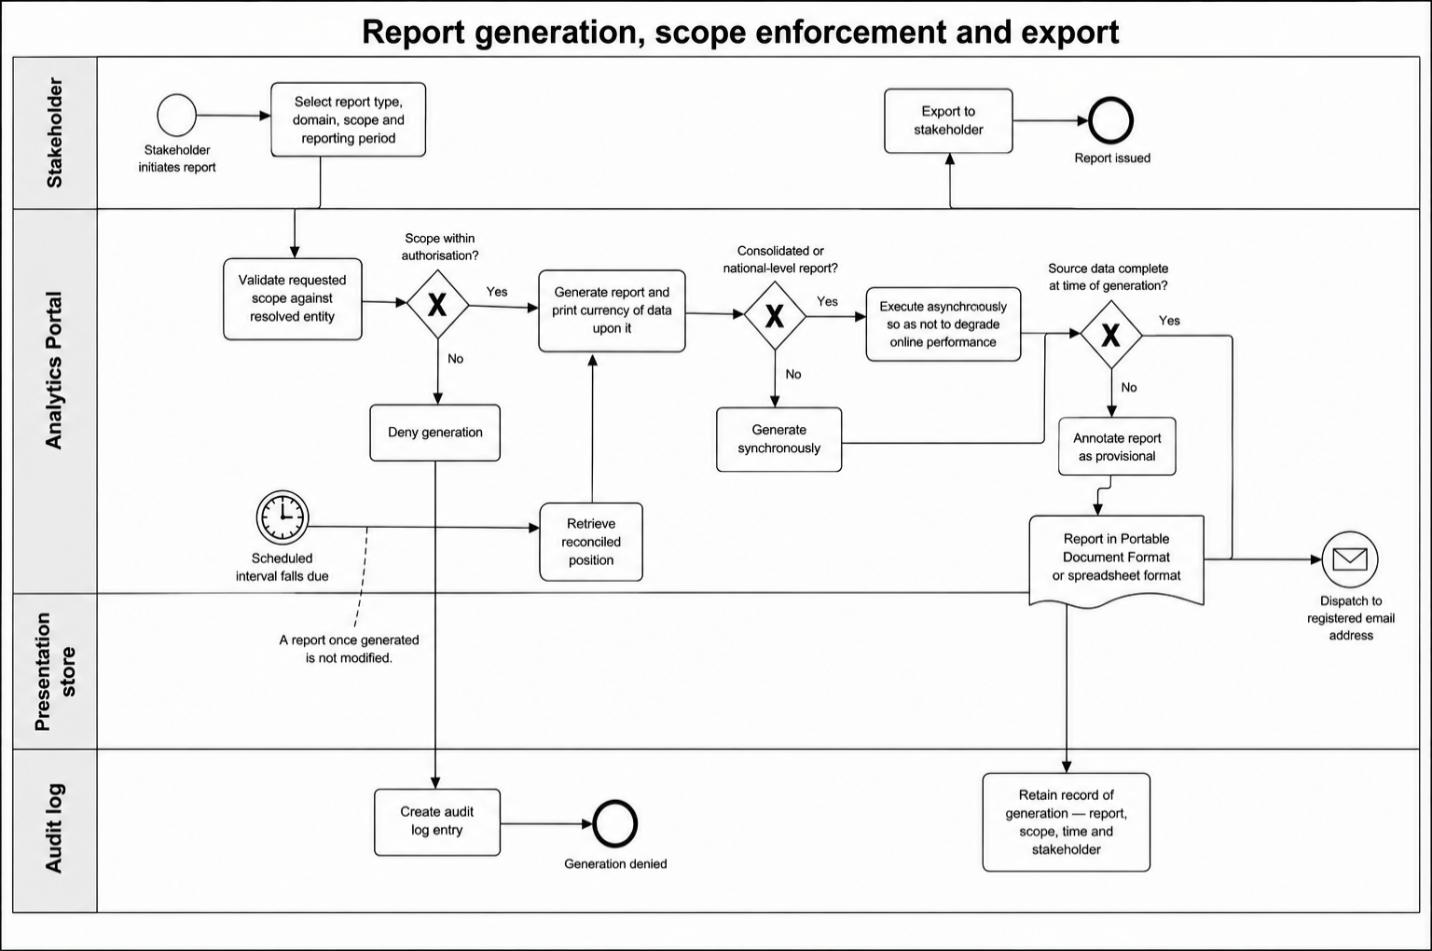
7.5. Report generation process design
No caption in source
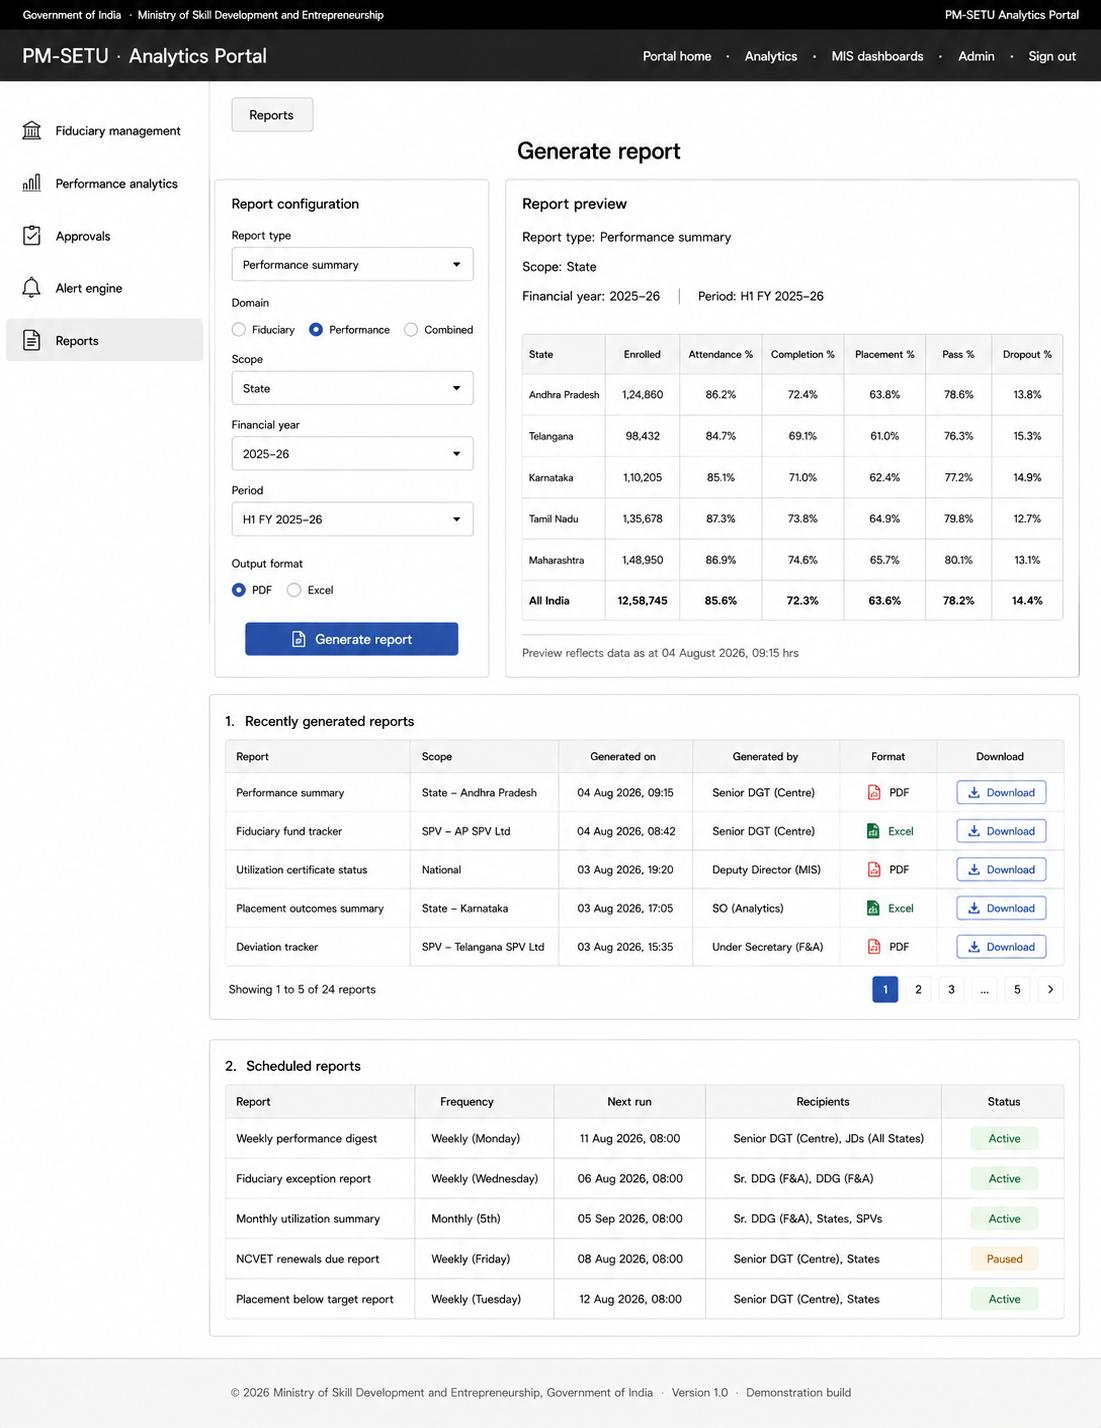
7.5. Report generation process design
No caption in source
Fiduciary Management System (FMS) (34 diagrams)
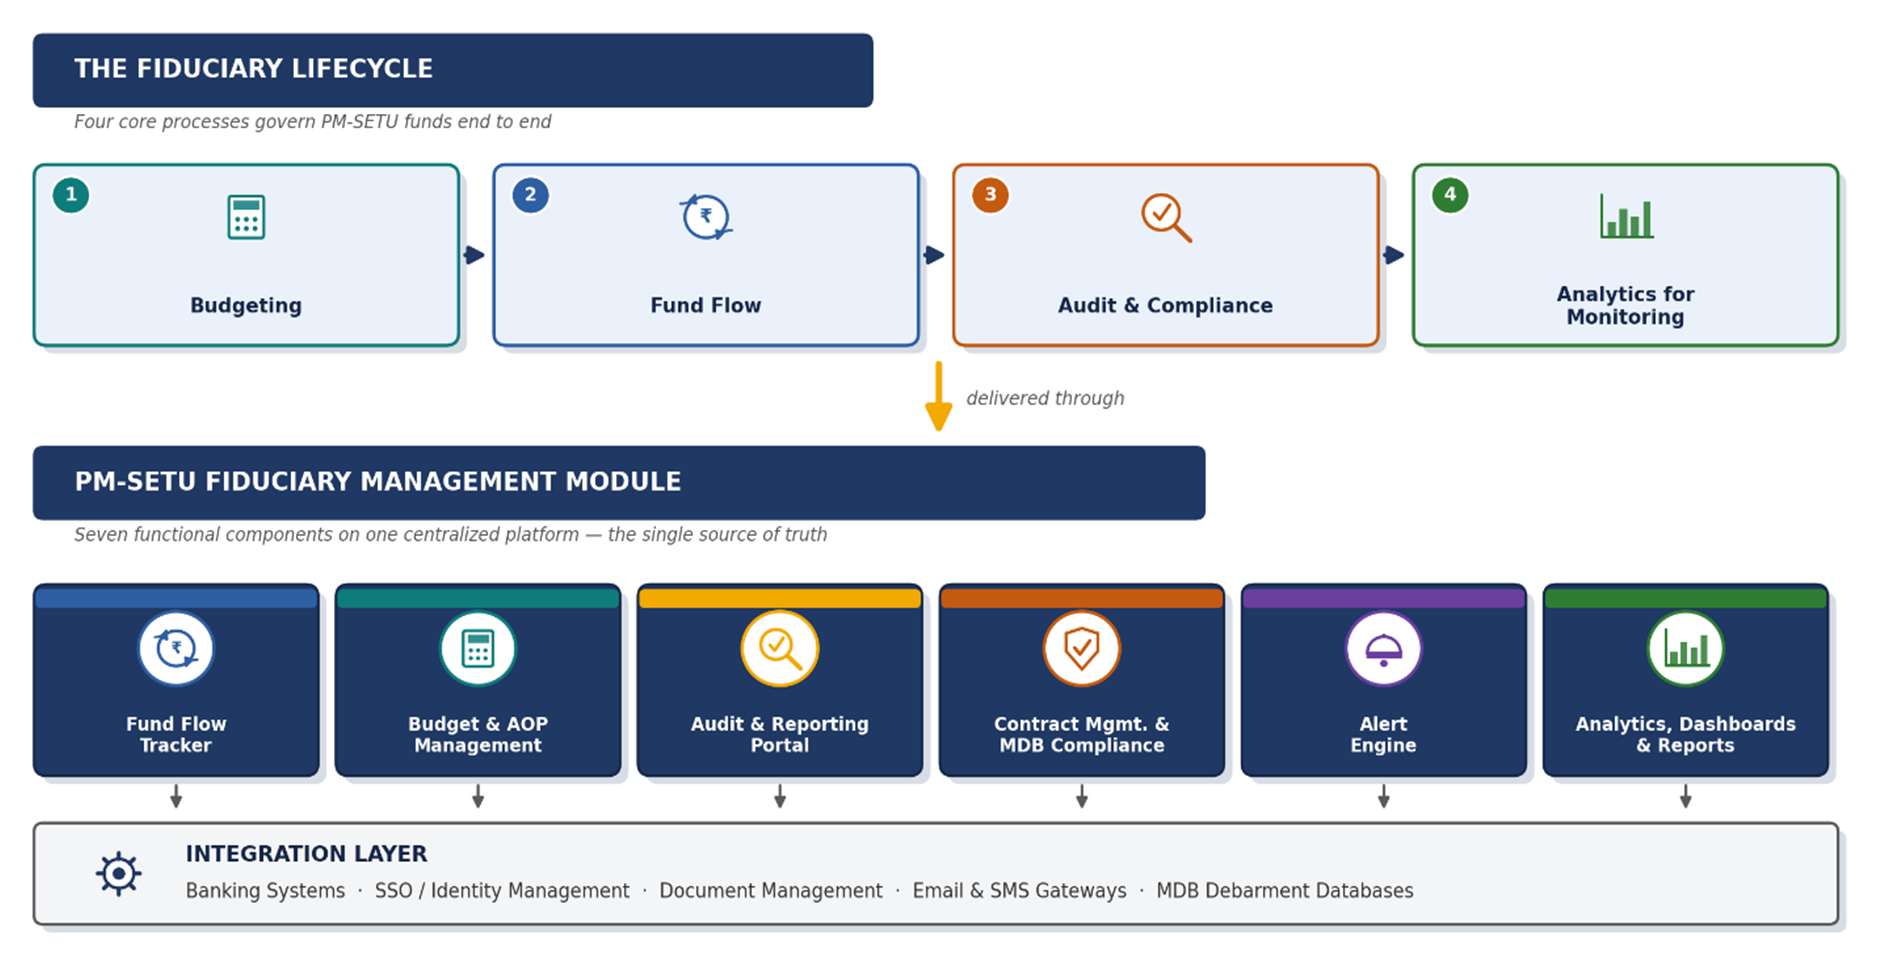
2. Business Requirements
No caption in source
Budget planning user journey
No caption in source
Budget planning user journey
No caption in source
Fund flow management journey
No caption in source
Fund flow management journey
No caption in source
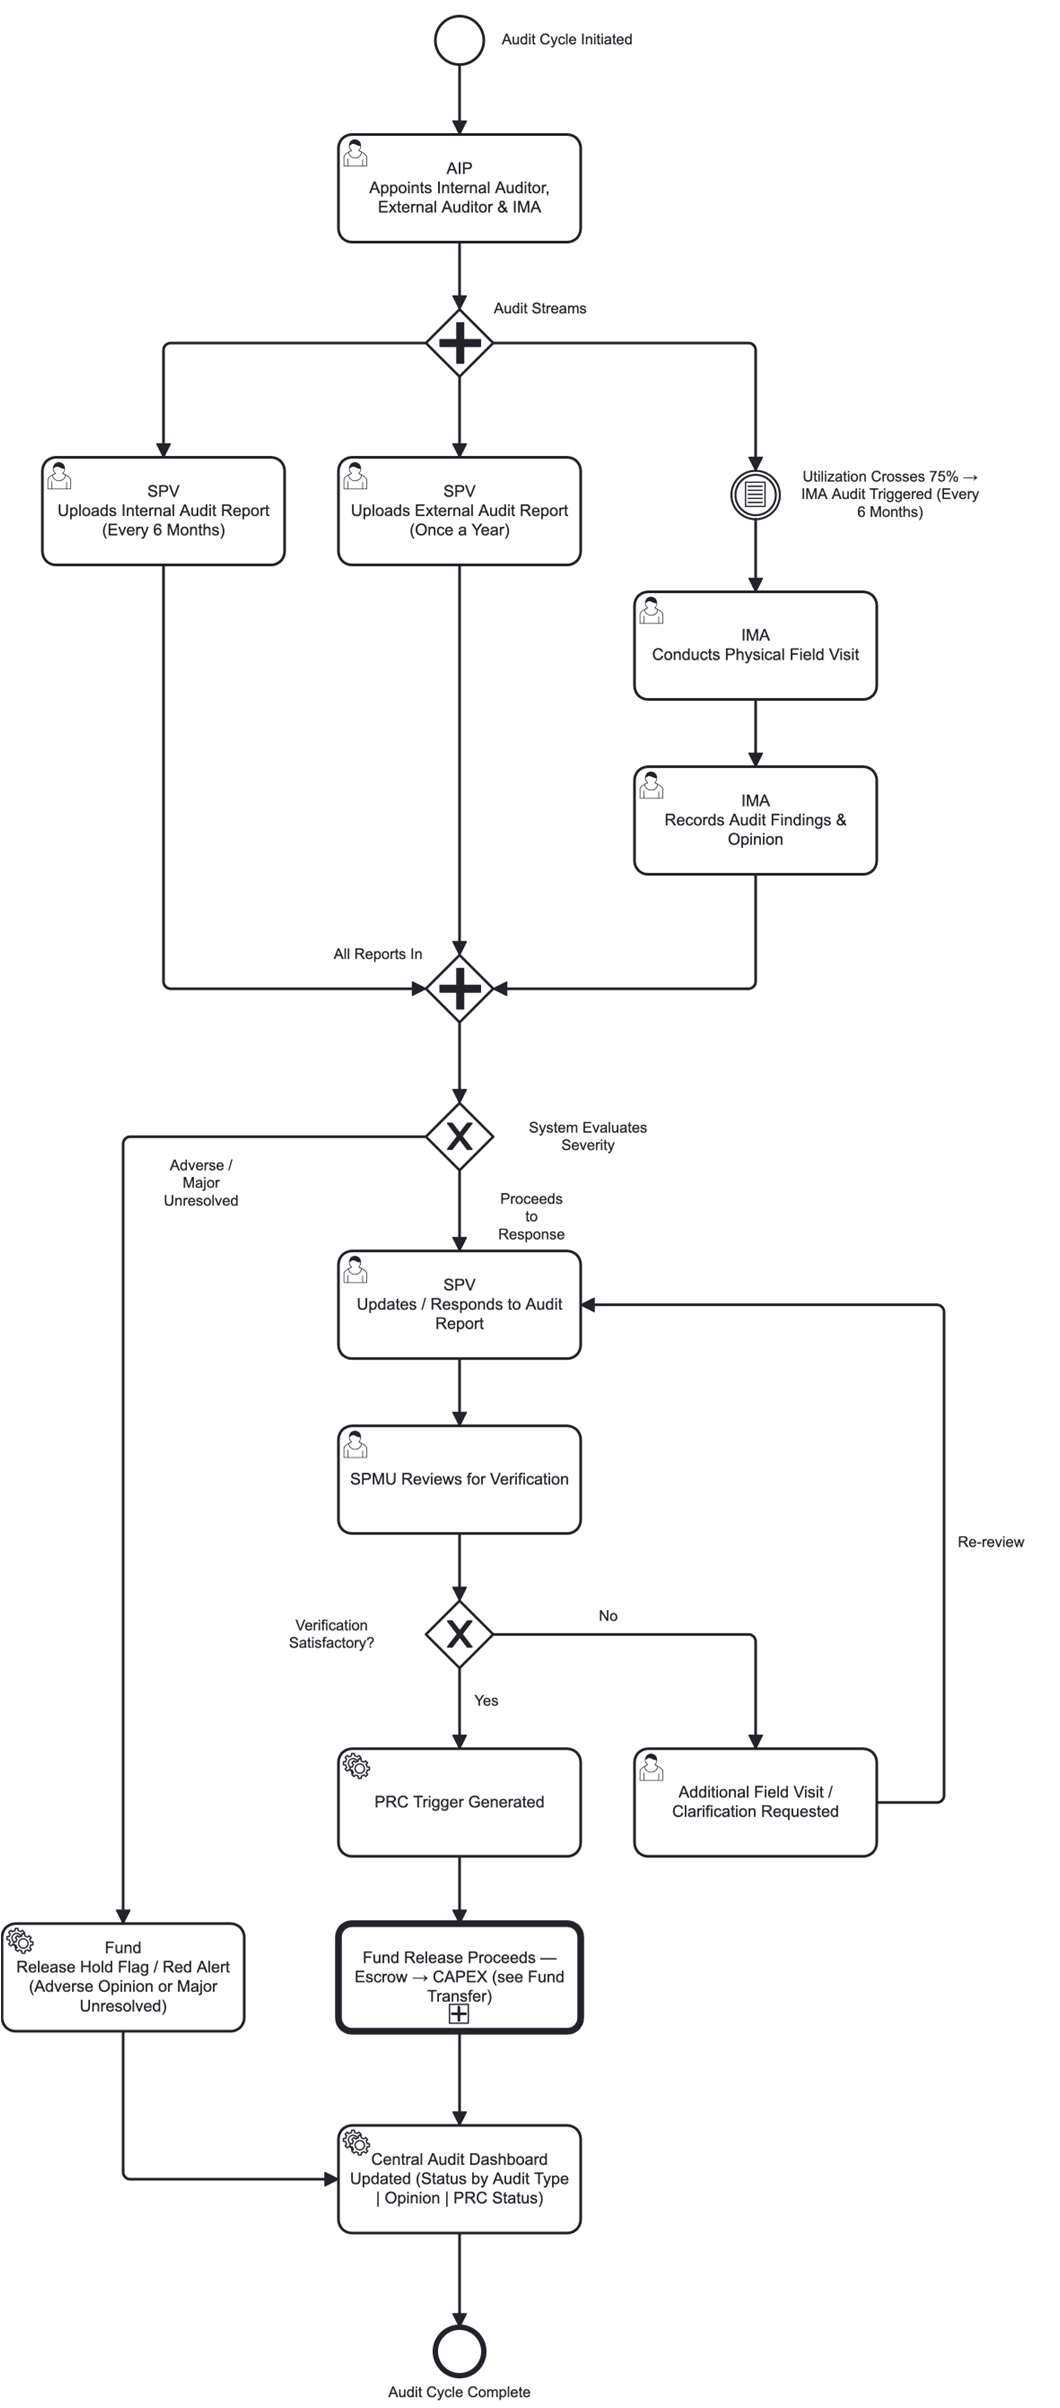
Audit user journey
No caption in source
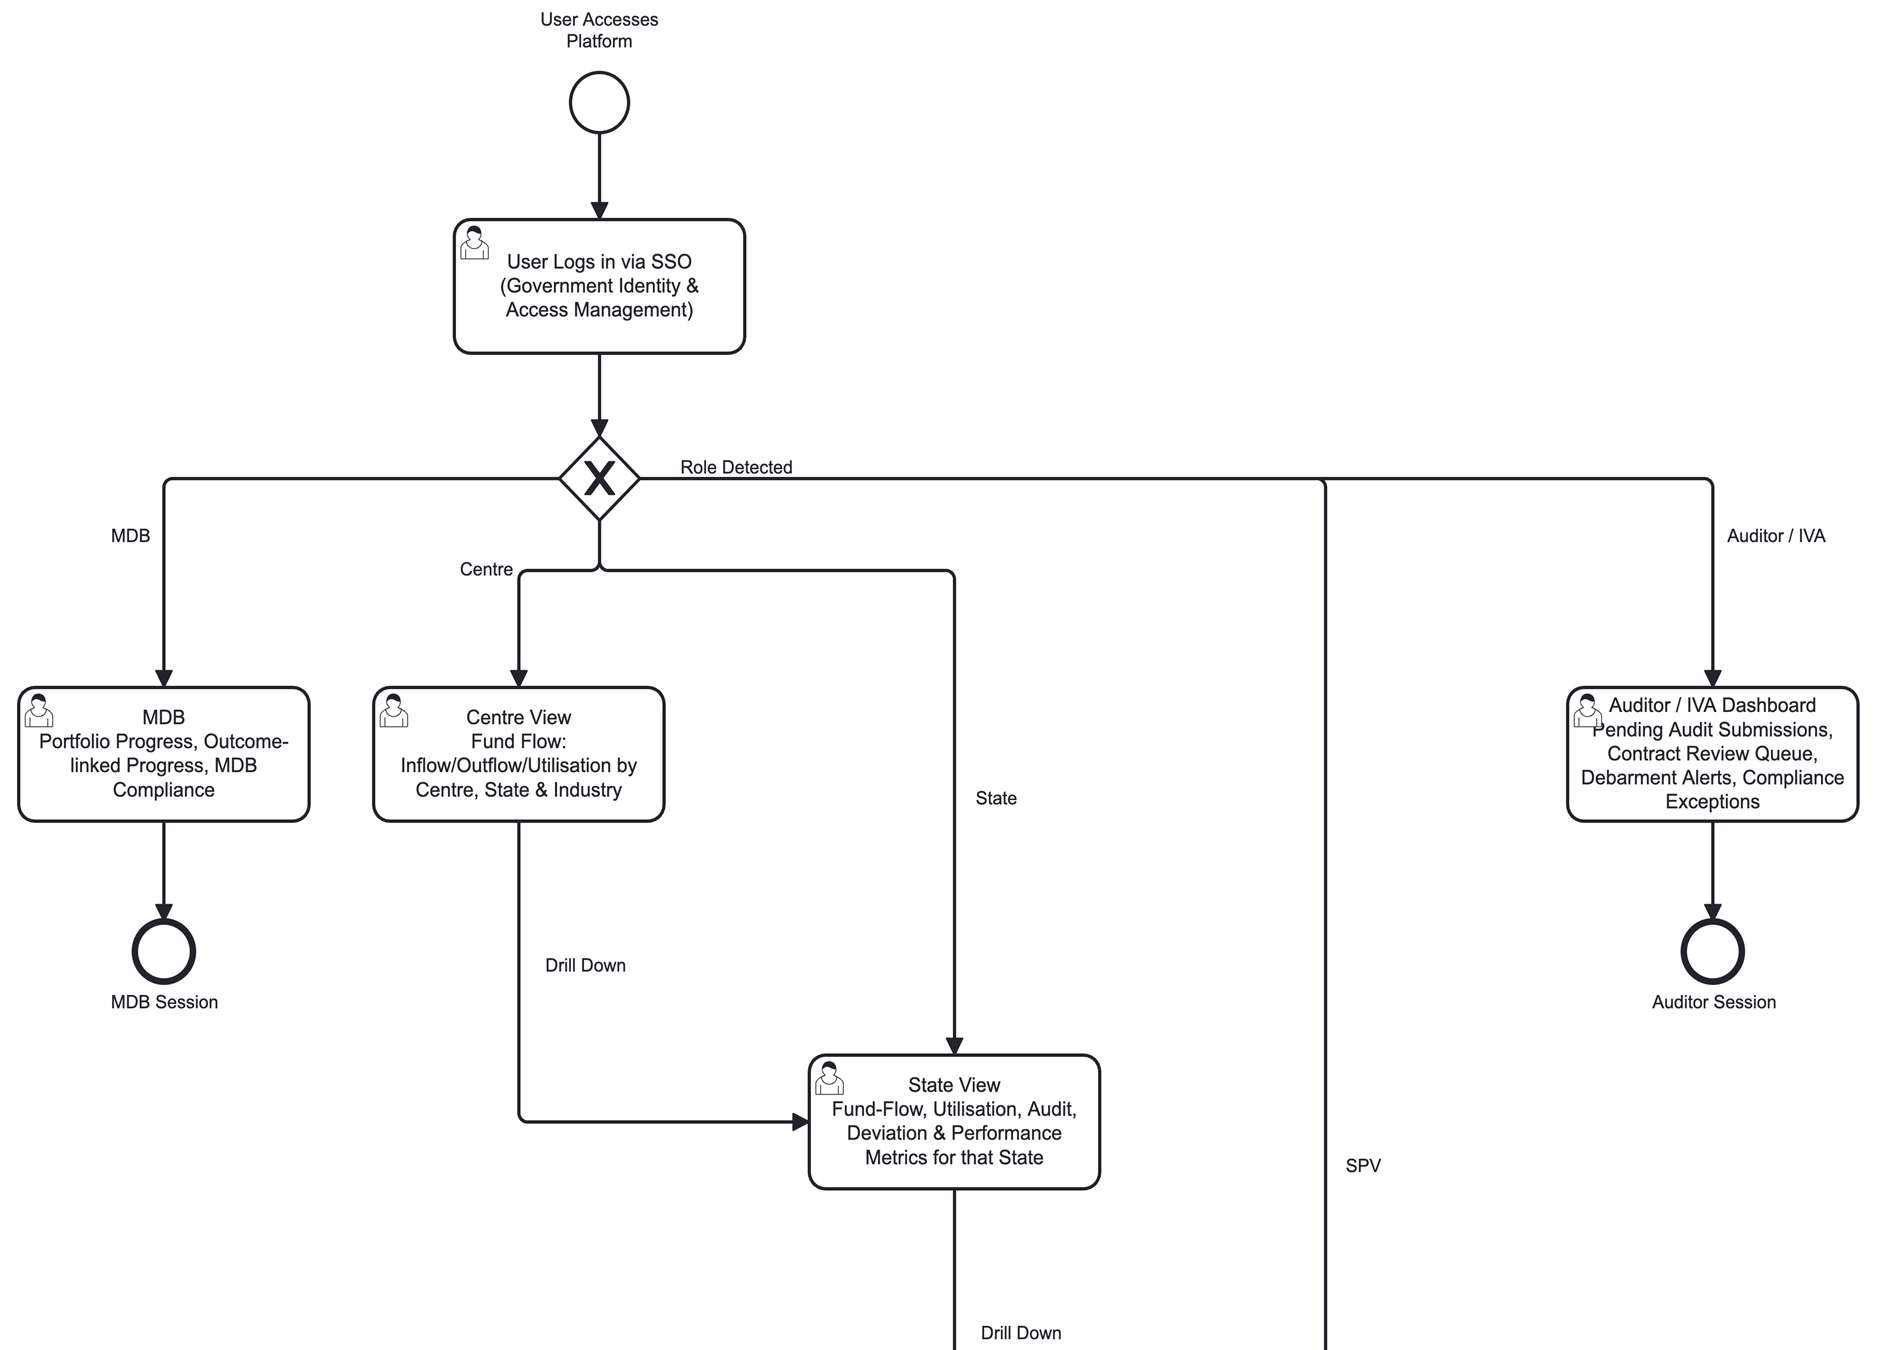
Analytics and dashboard user journey
No caption in source
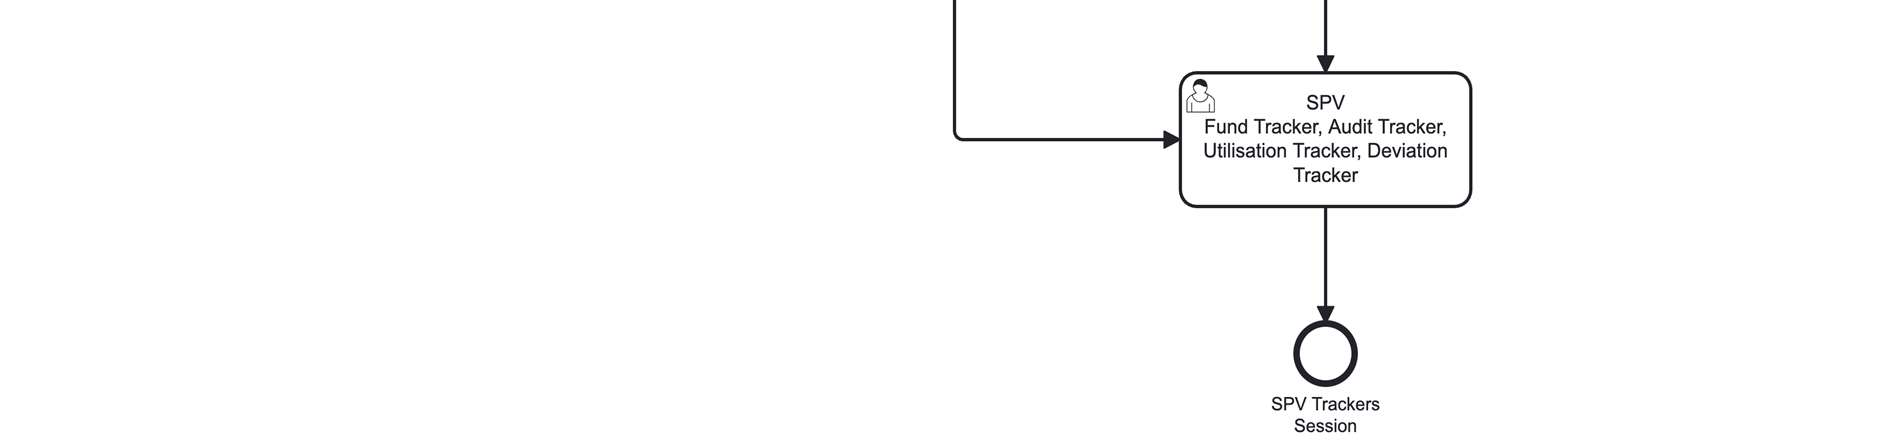
Analytics and dashboard user journey
Figure 5 Analytics and dashboard user journey
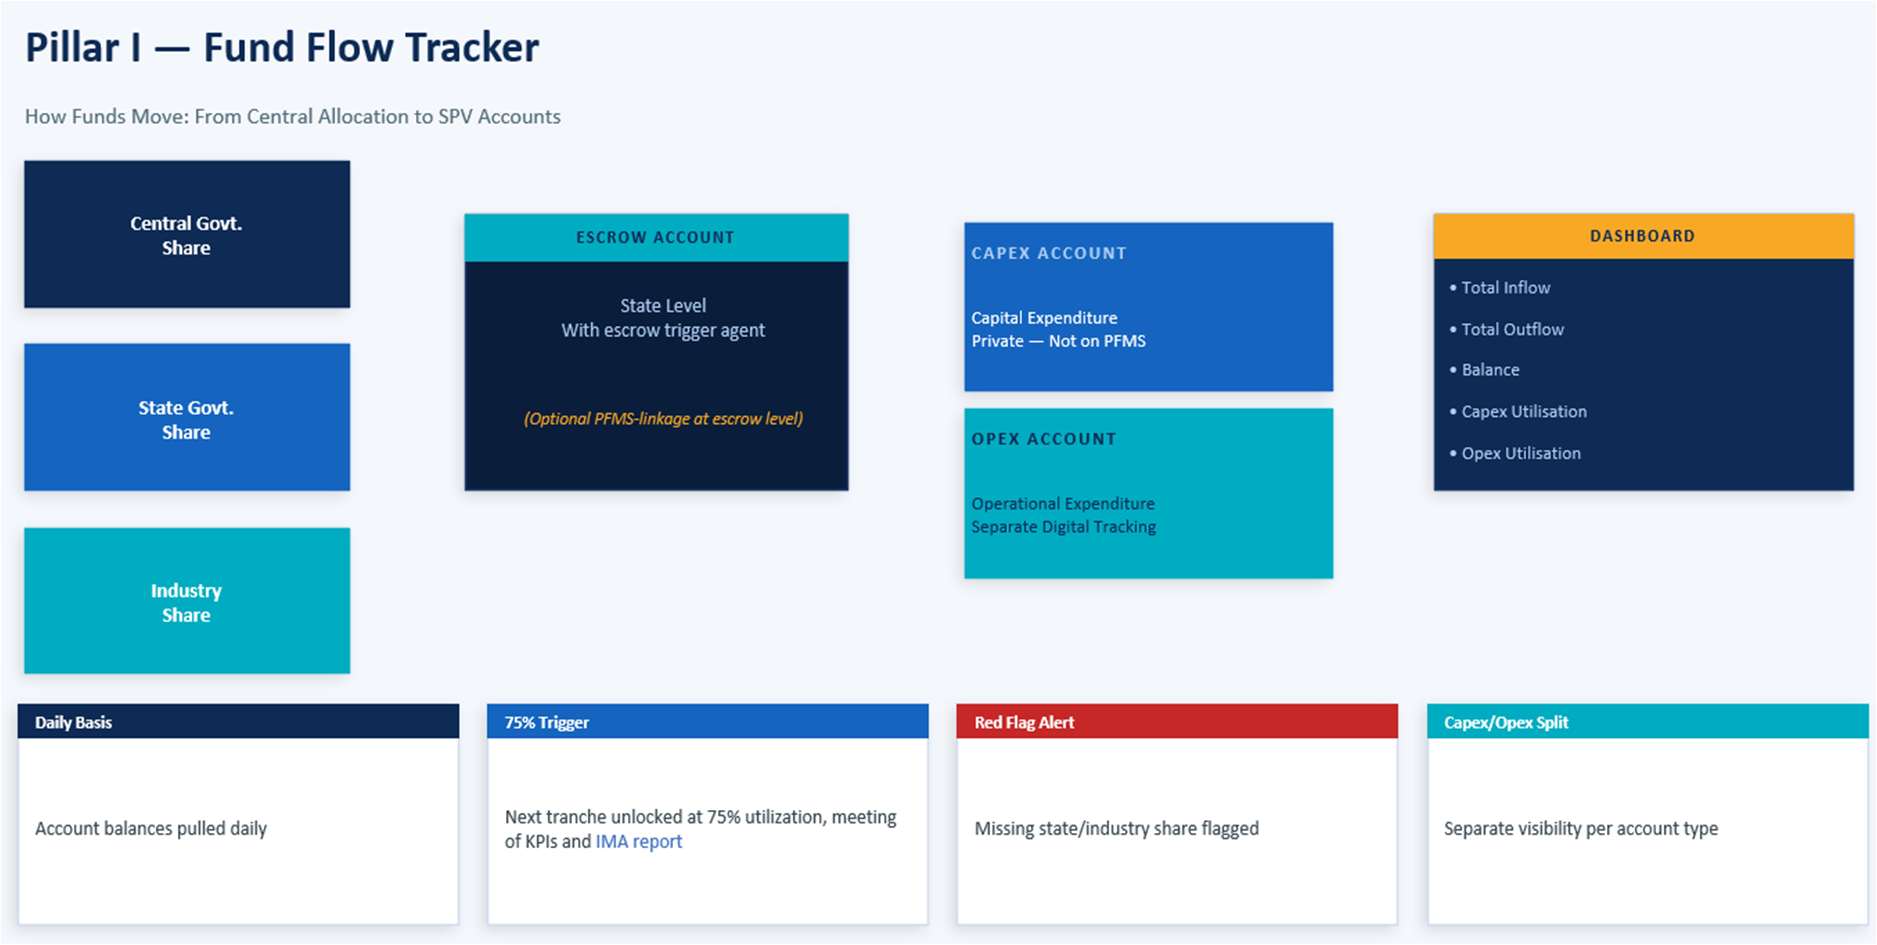
Pillar 1: Fund flow tracker
No caption in source
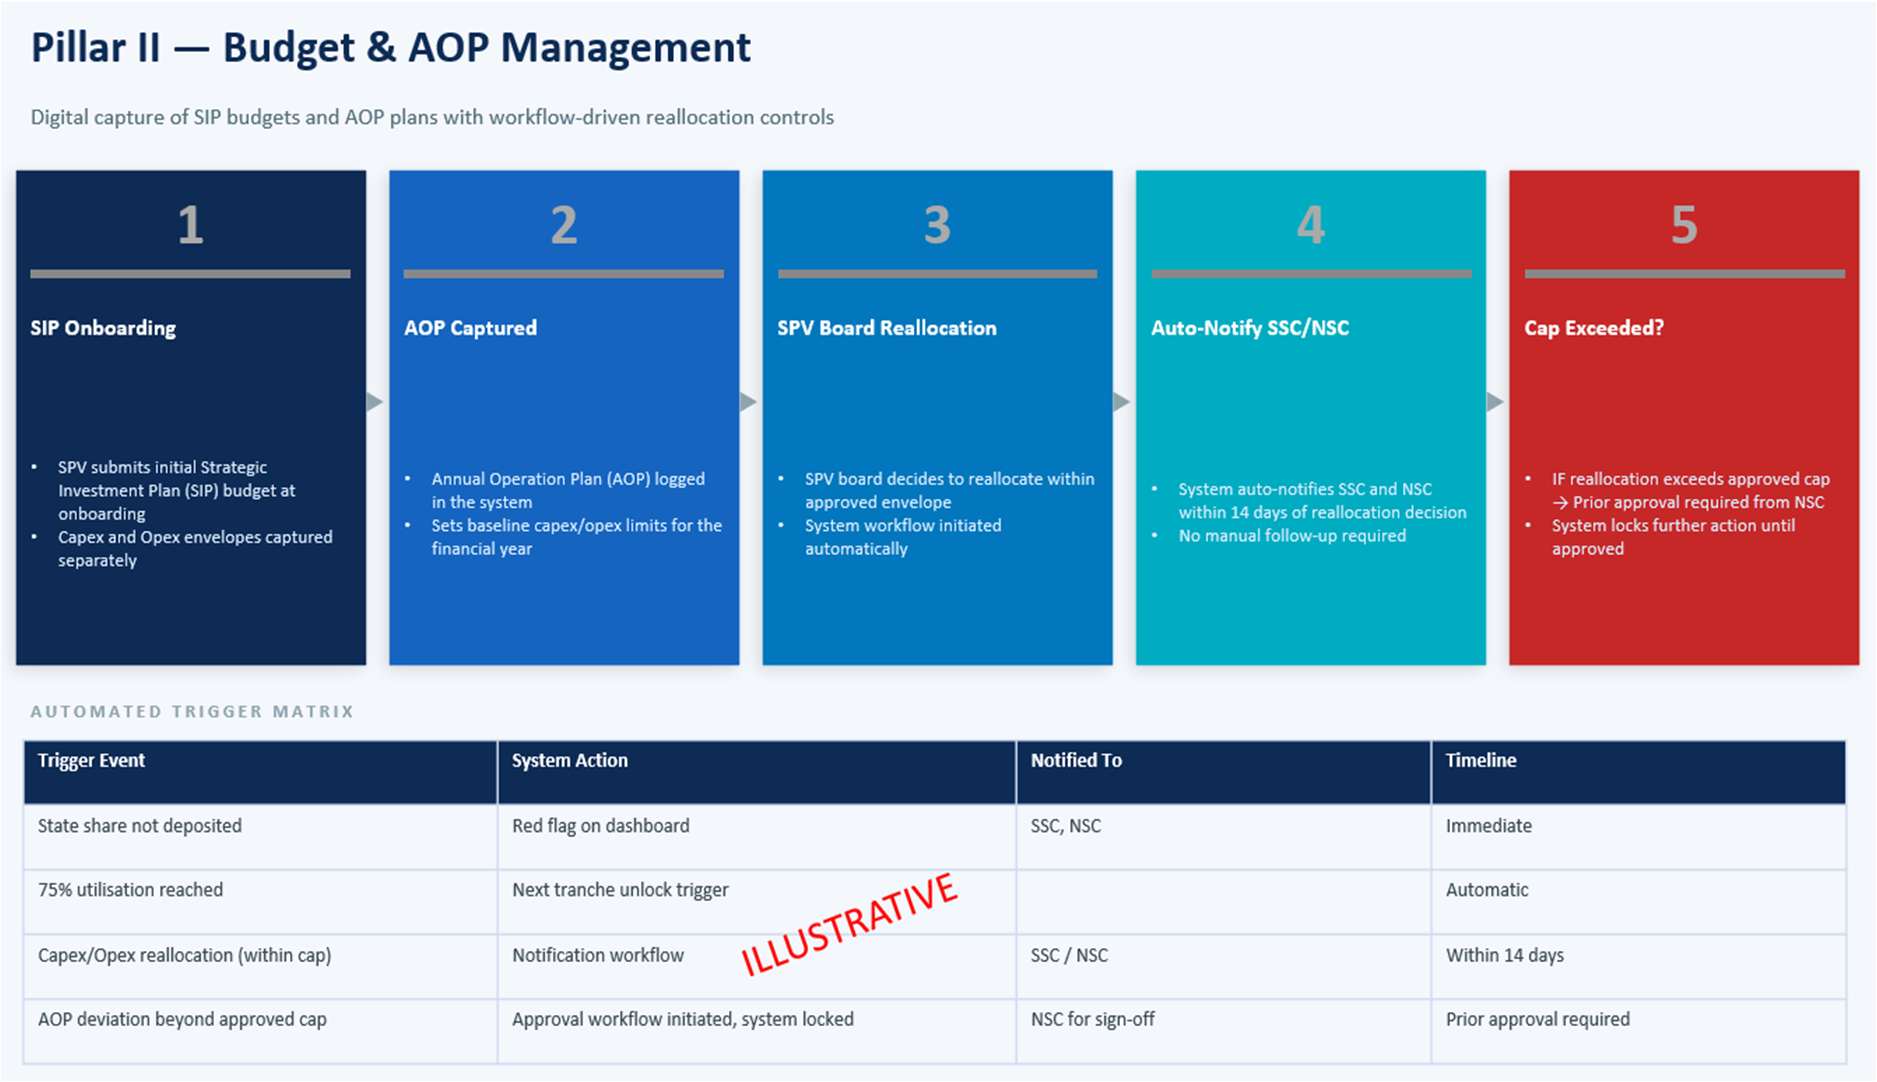
Pillar 2: Budget & AOP management
No caption in source
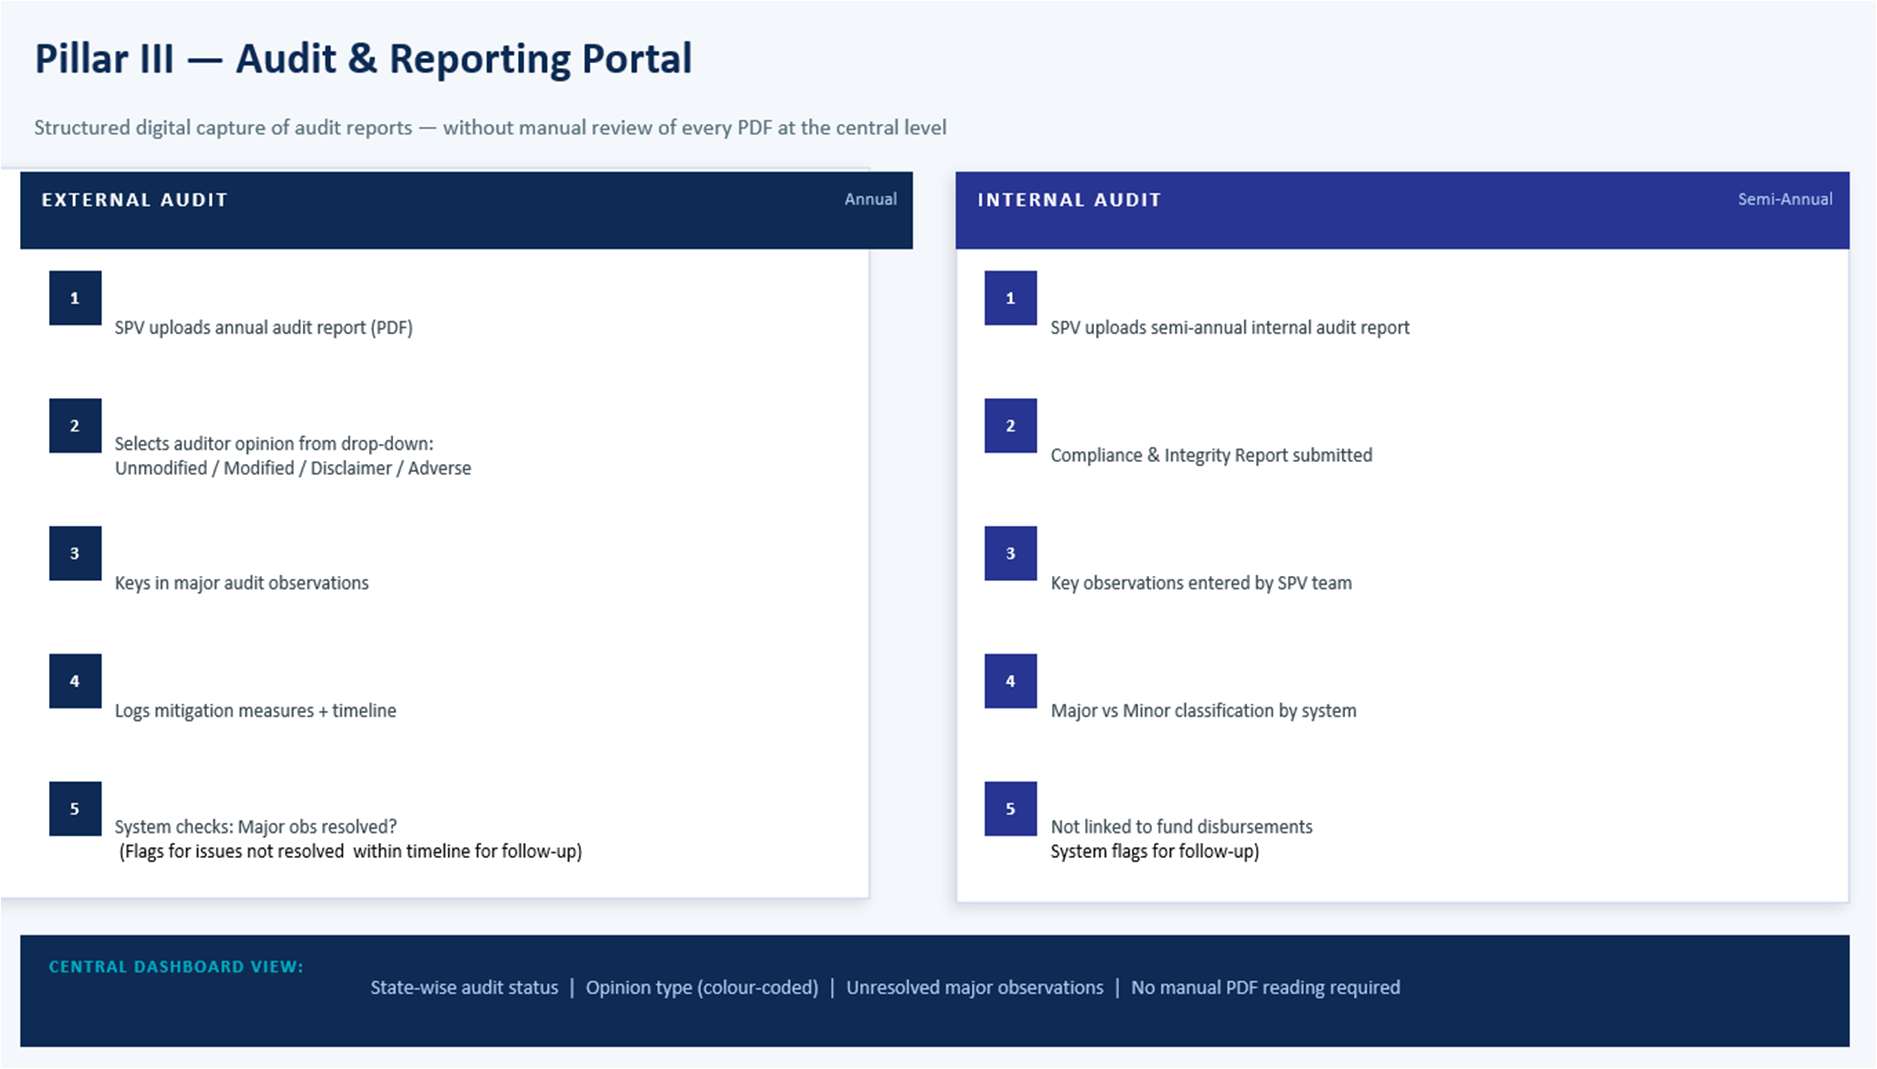
Pillar 3: Audit & reporting portal
No caption in source
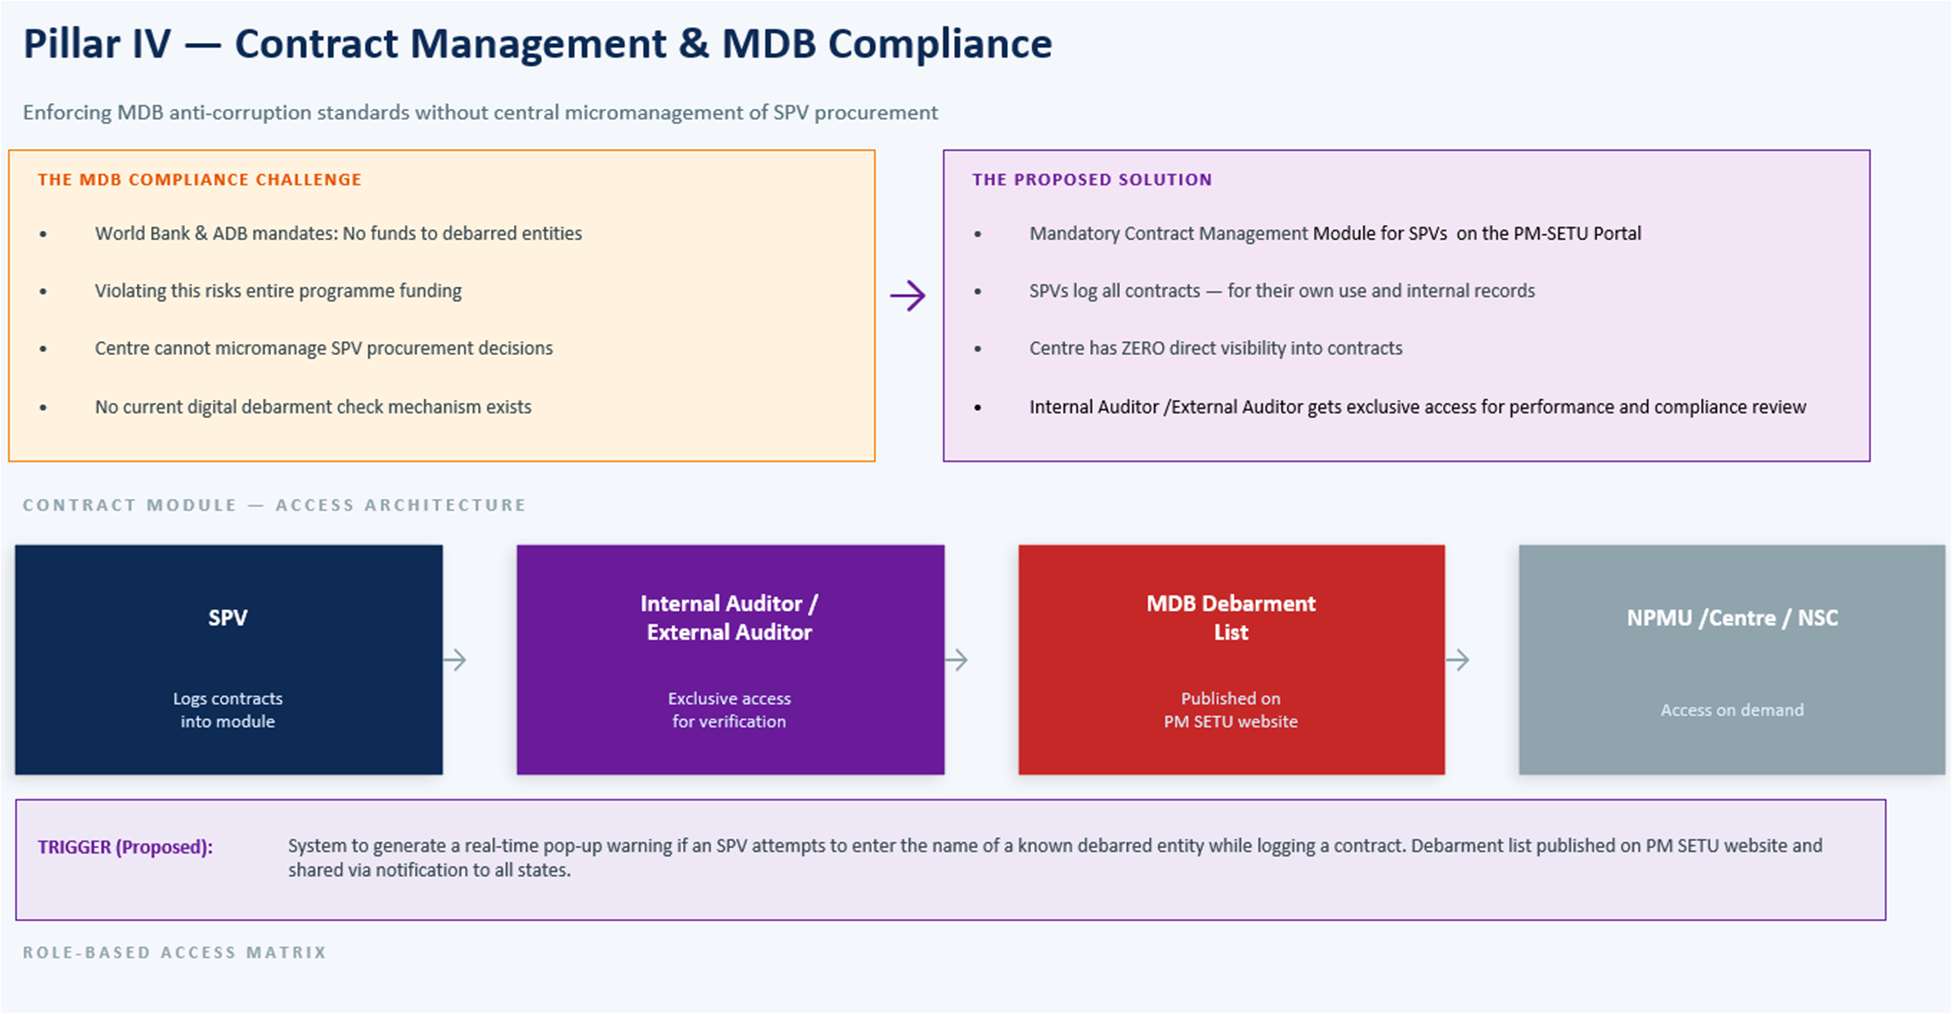
Pillar 4: Contract management & MDB compliance
No caption in source
Pillar 6: Analytics, dashboards & reports
No caption in source
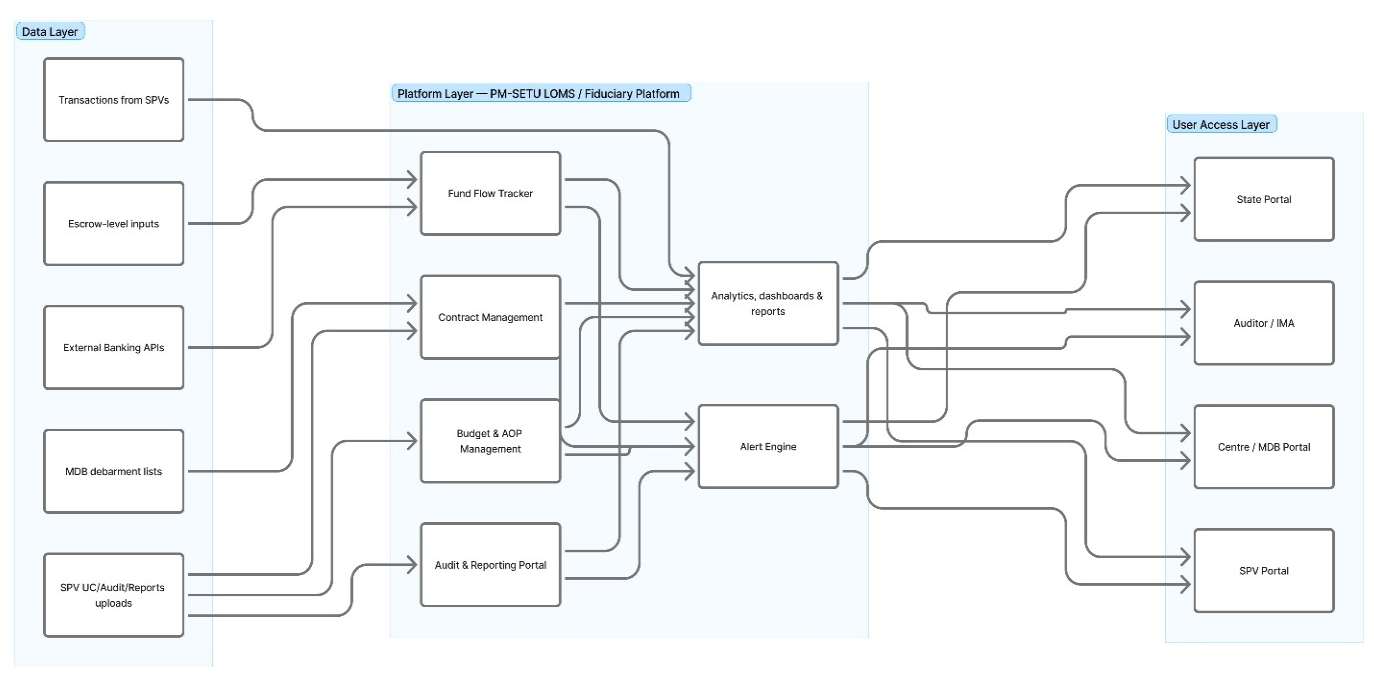
4. Solution architecture
No caption in source
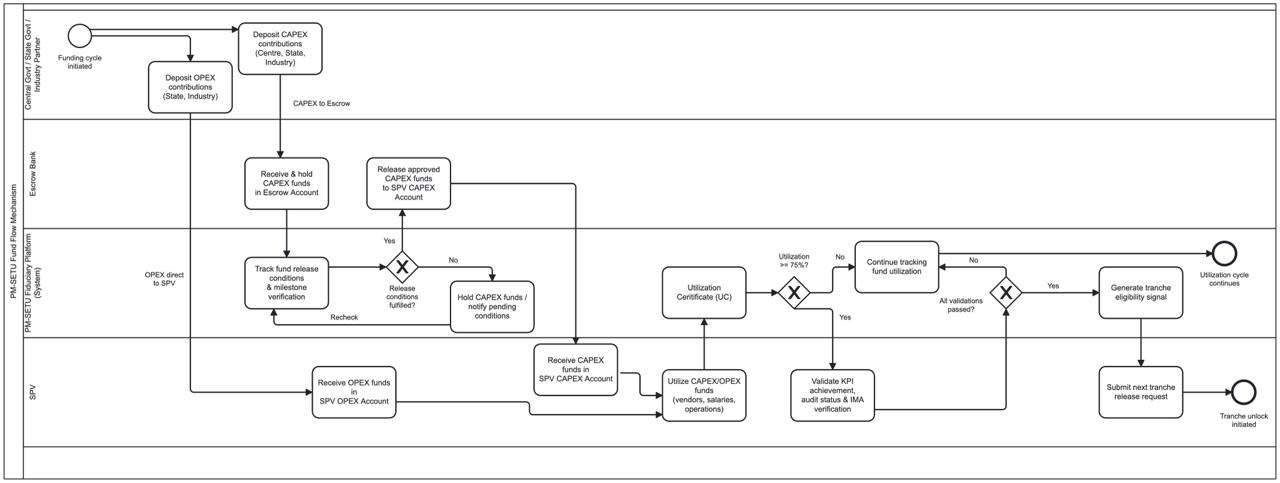
Fund flow process design and mockups
No caption in source
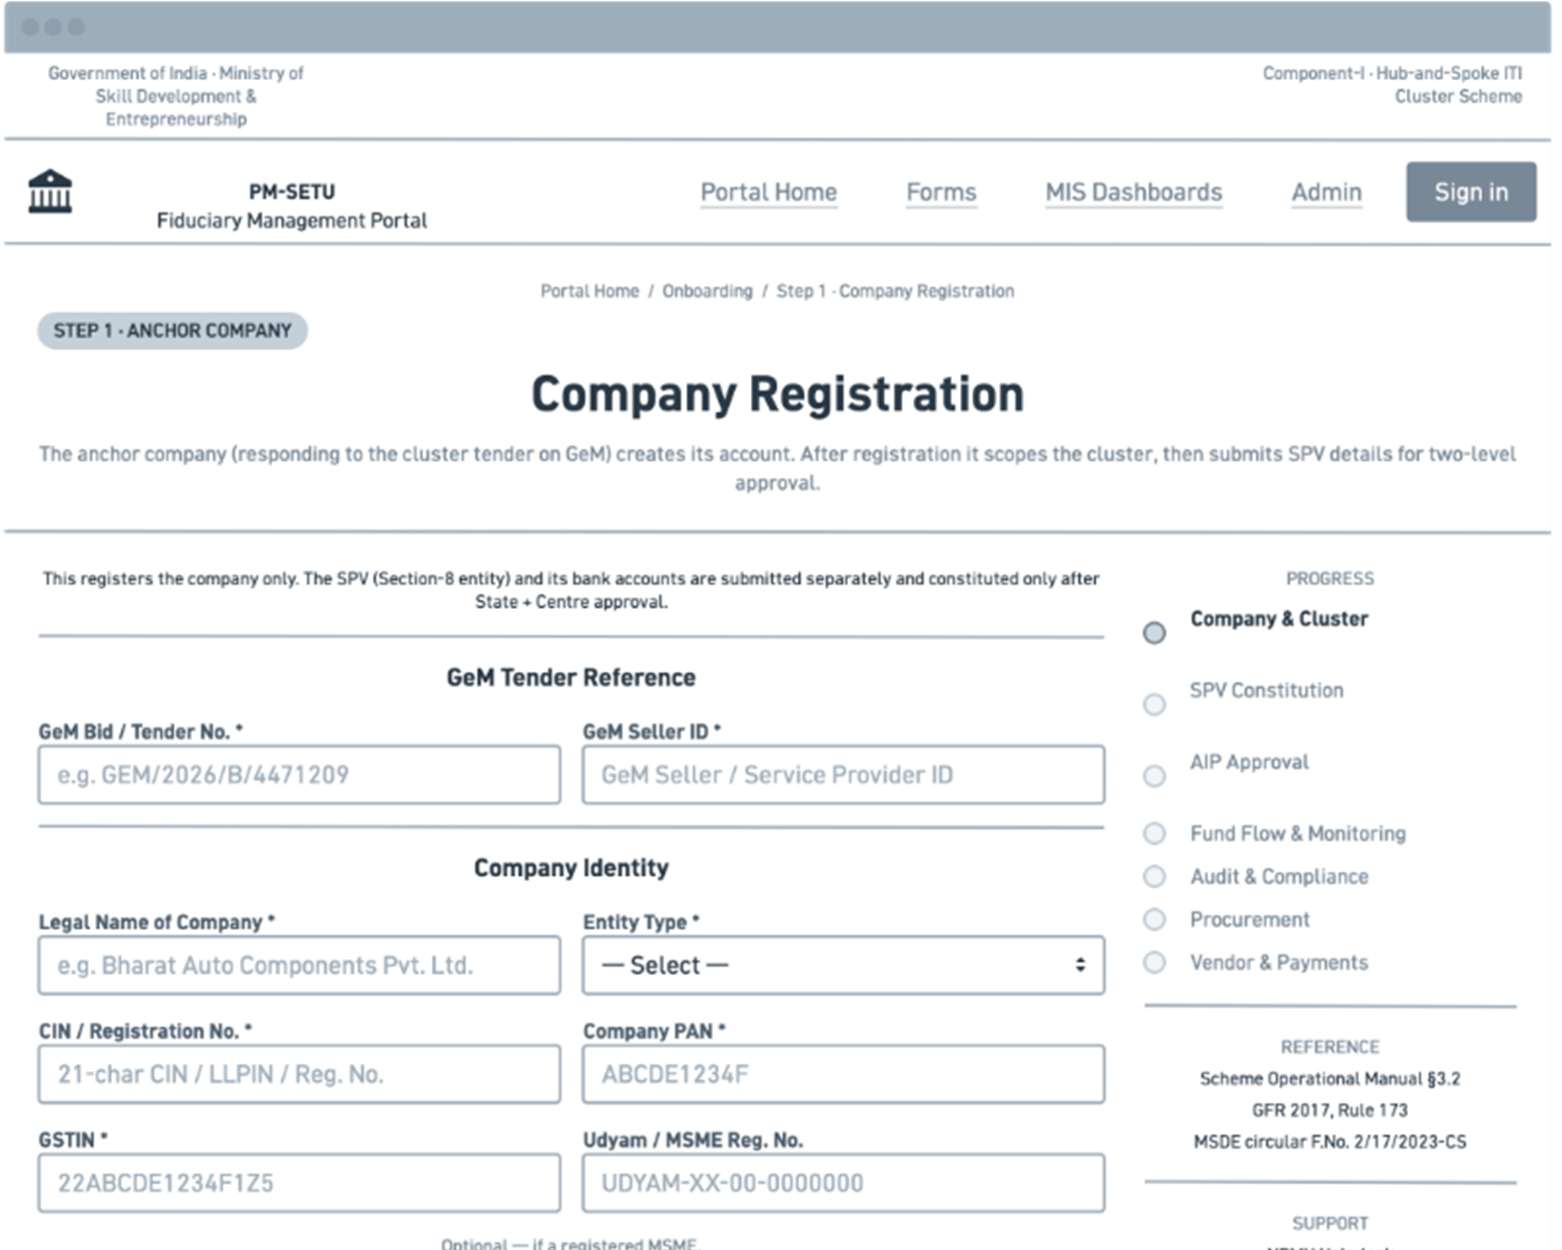
Fund flow process design and mockups
No caption in source
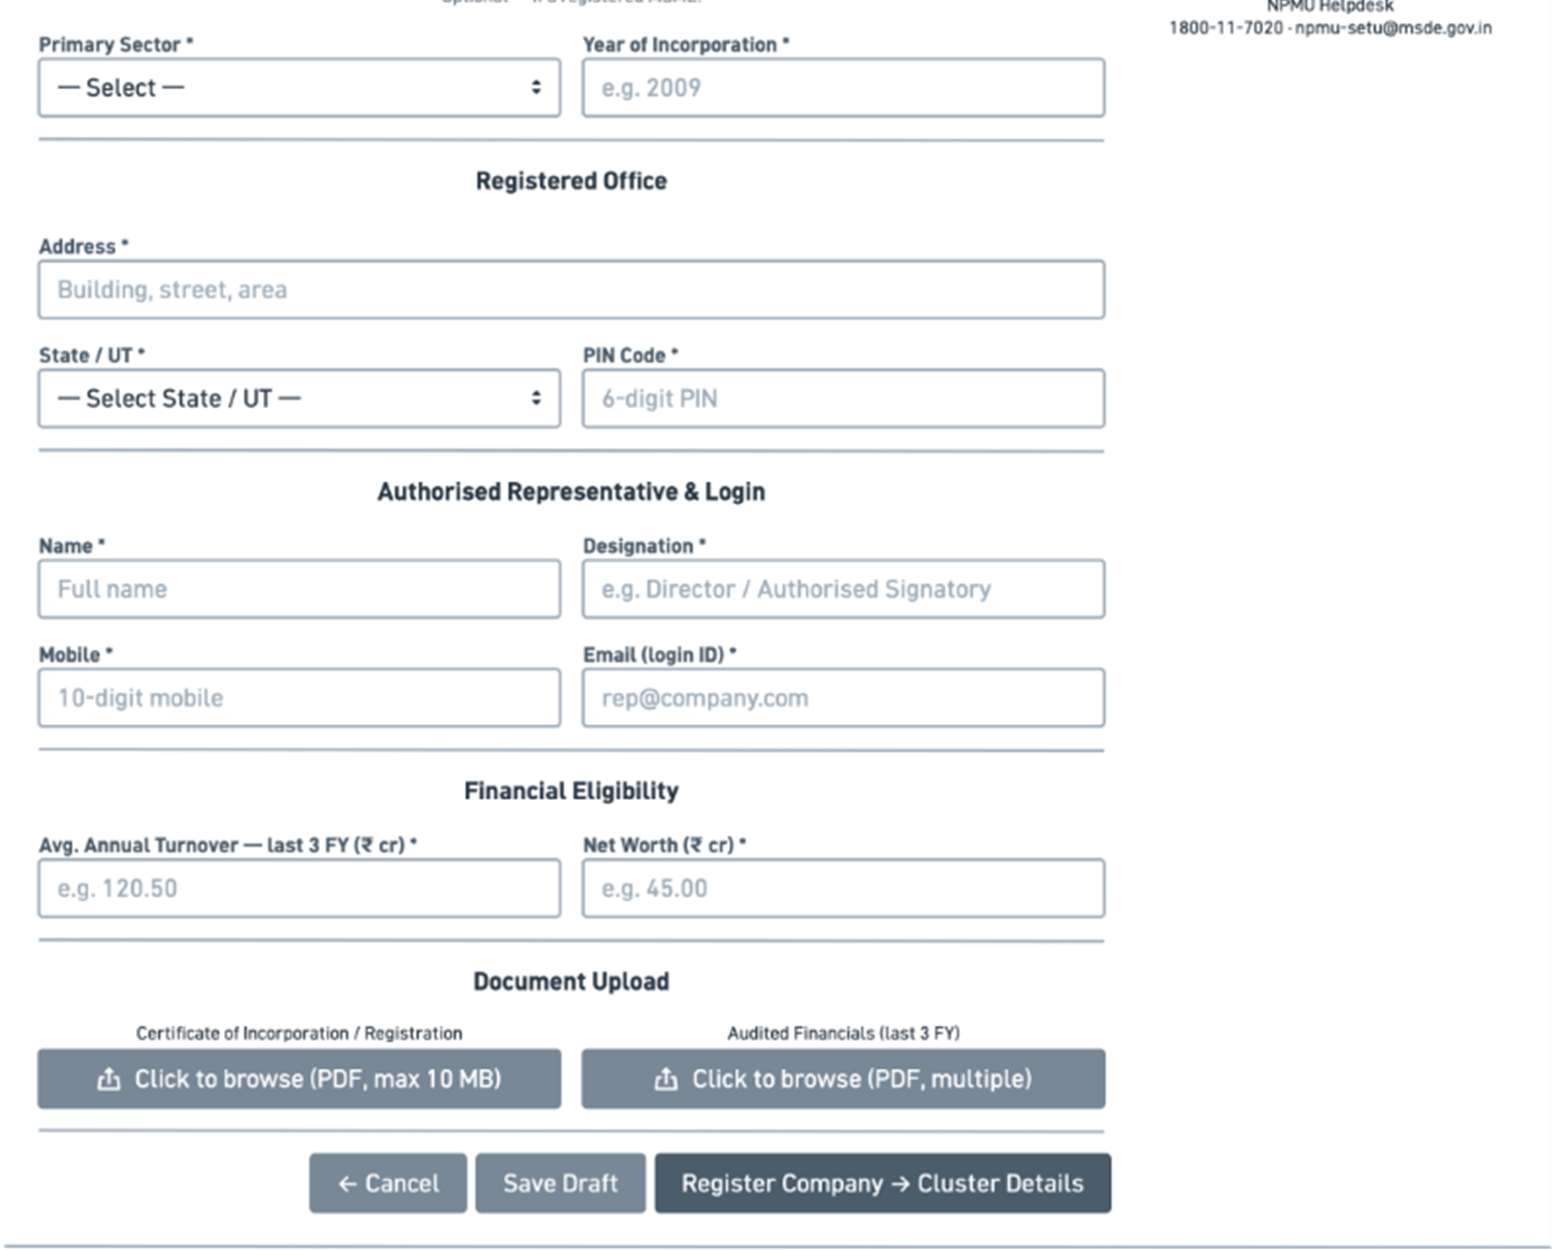
Fund flow process design and mockups
No caption in source
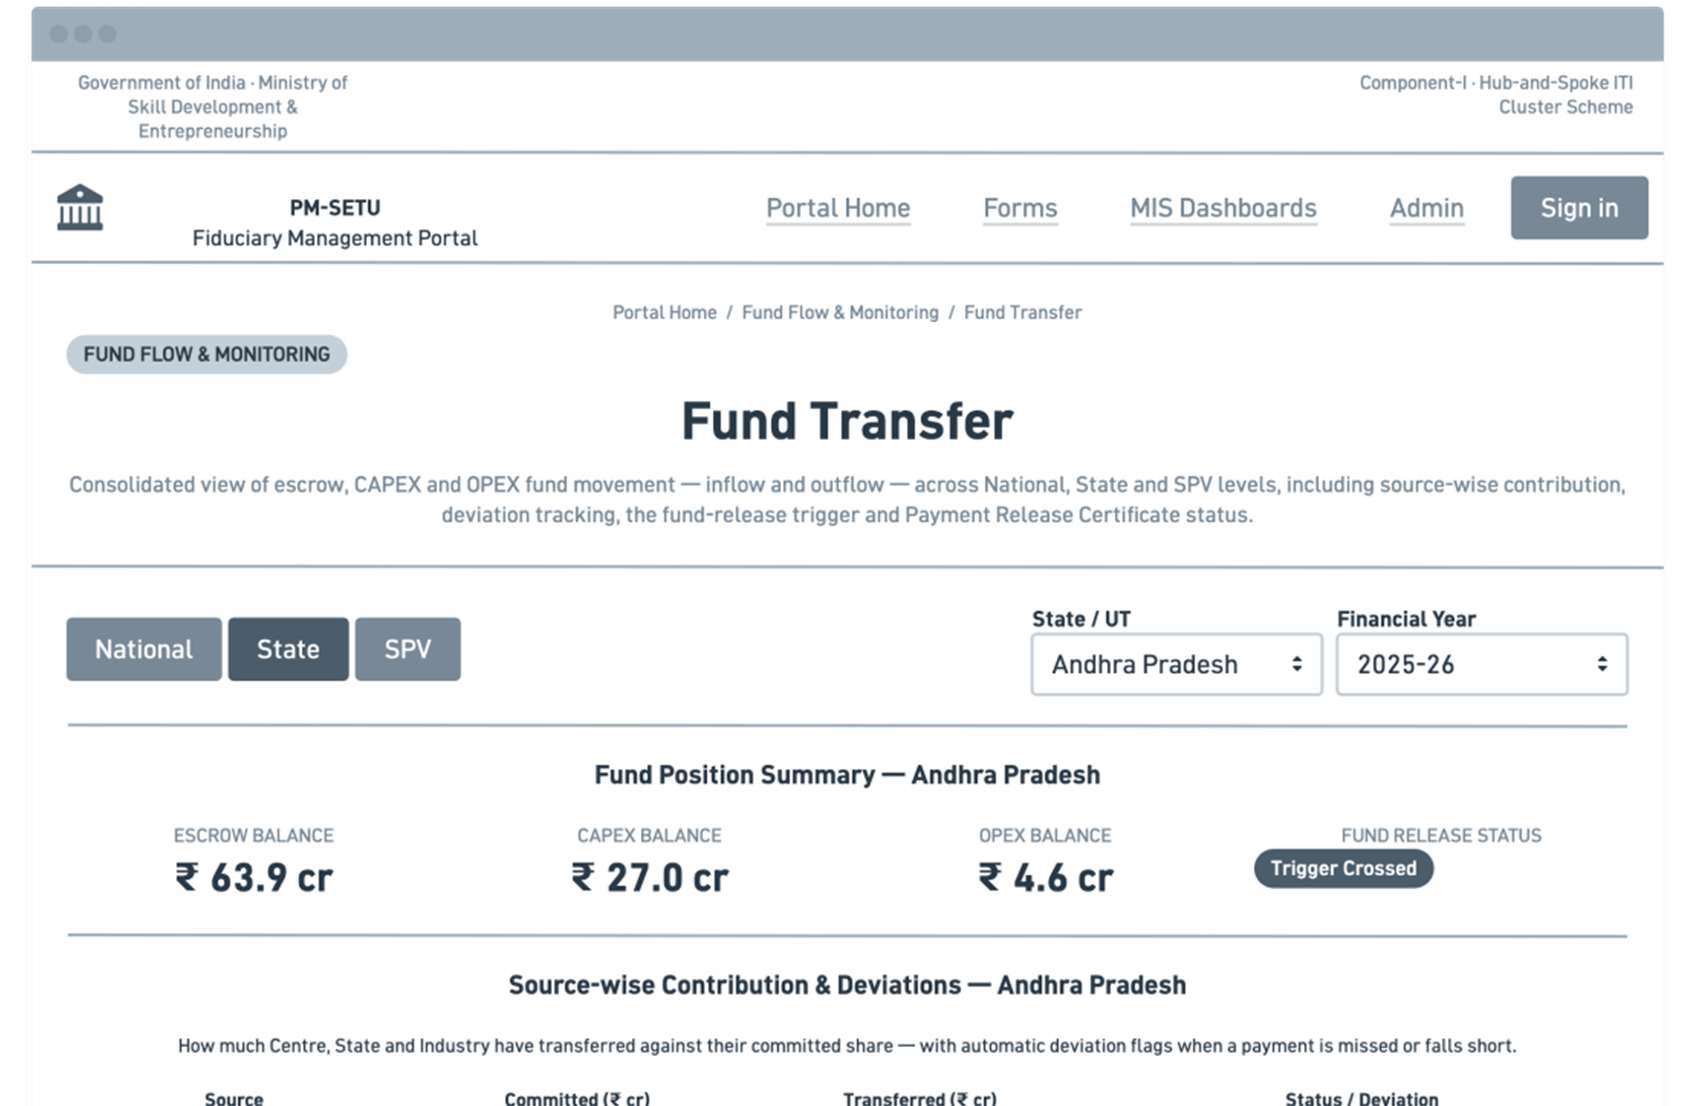
Fund flow process design and mockups
No caption in source
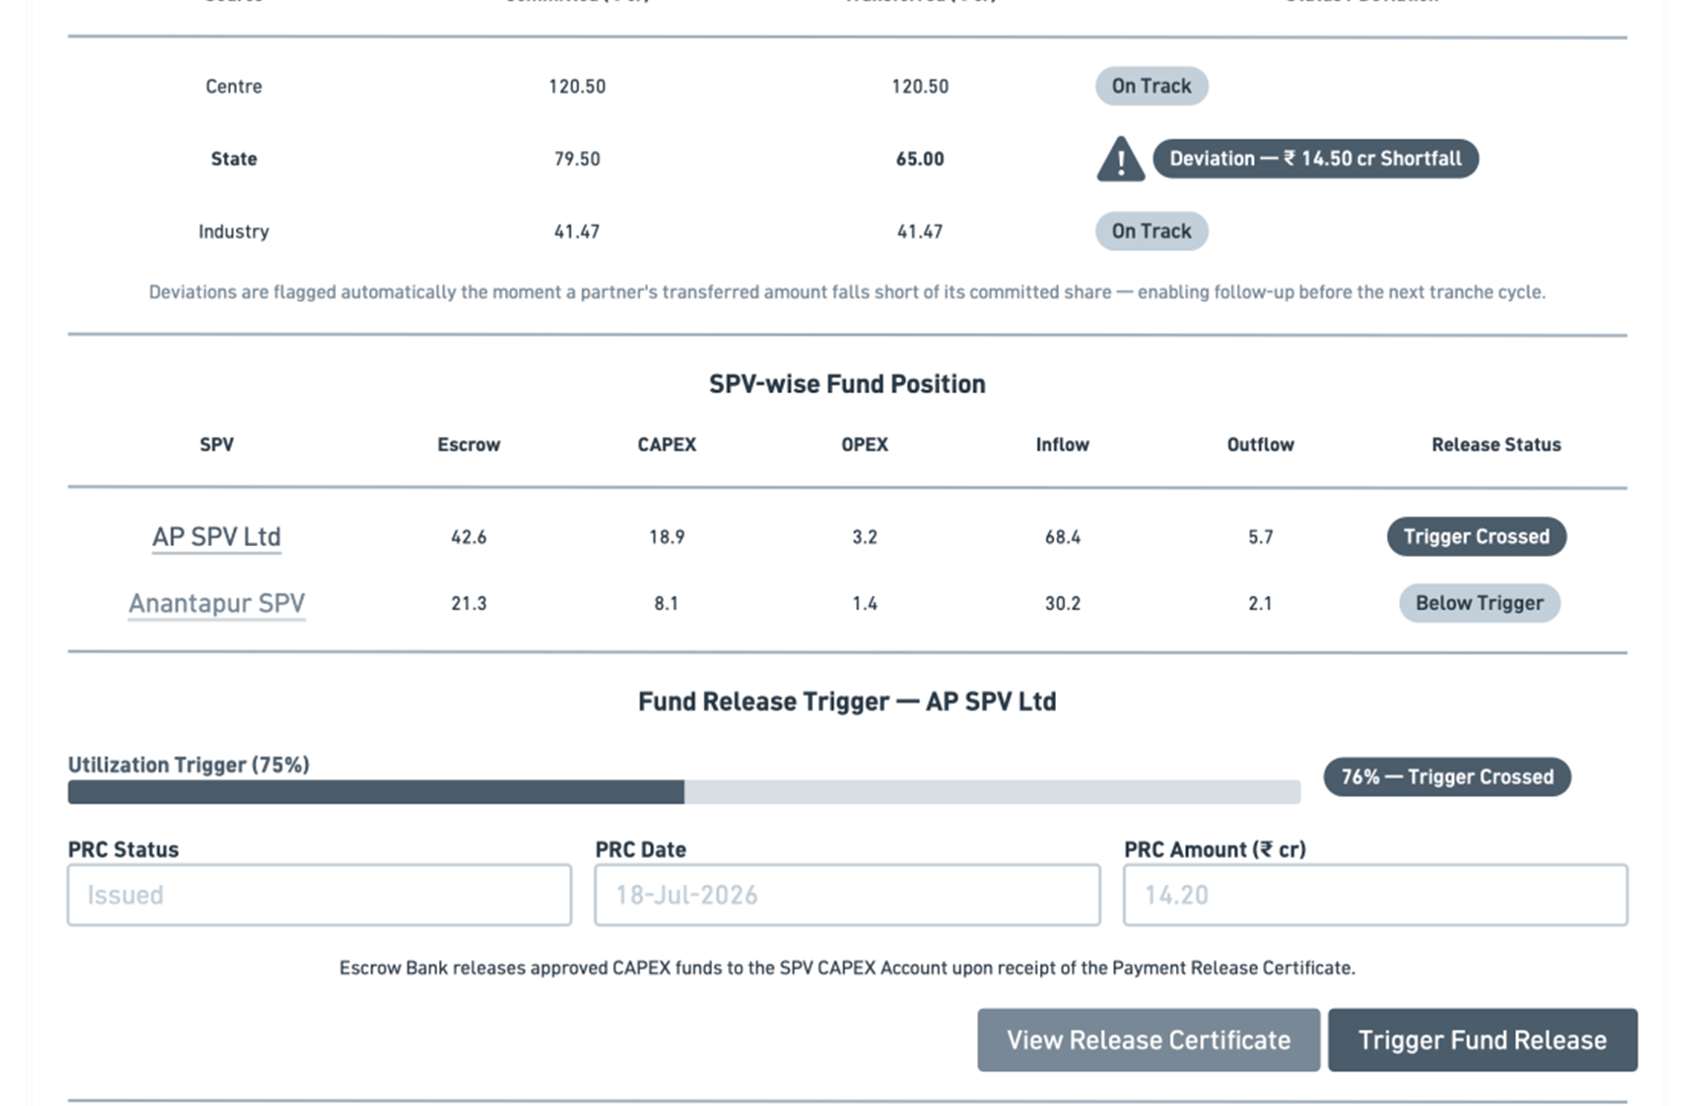
Fund flow process design and mockups
No caption in source
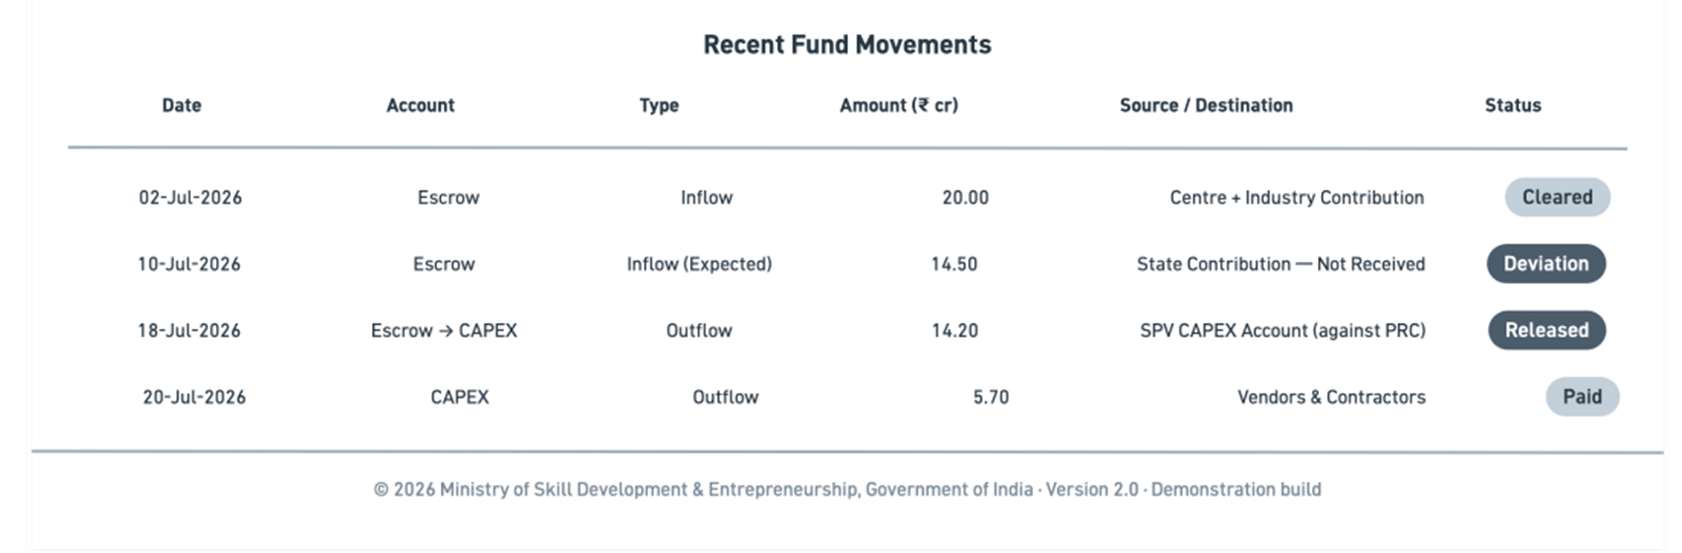
Fund flow process design and mockups
No caption in source
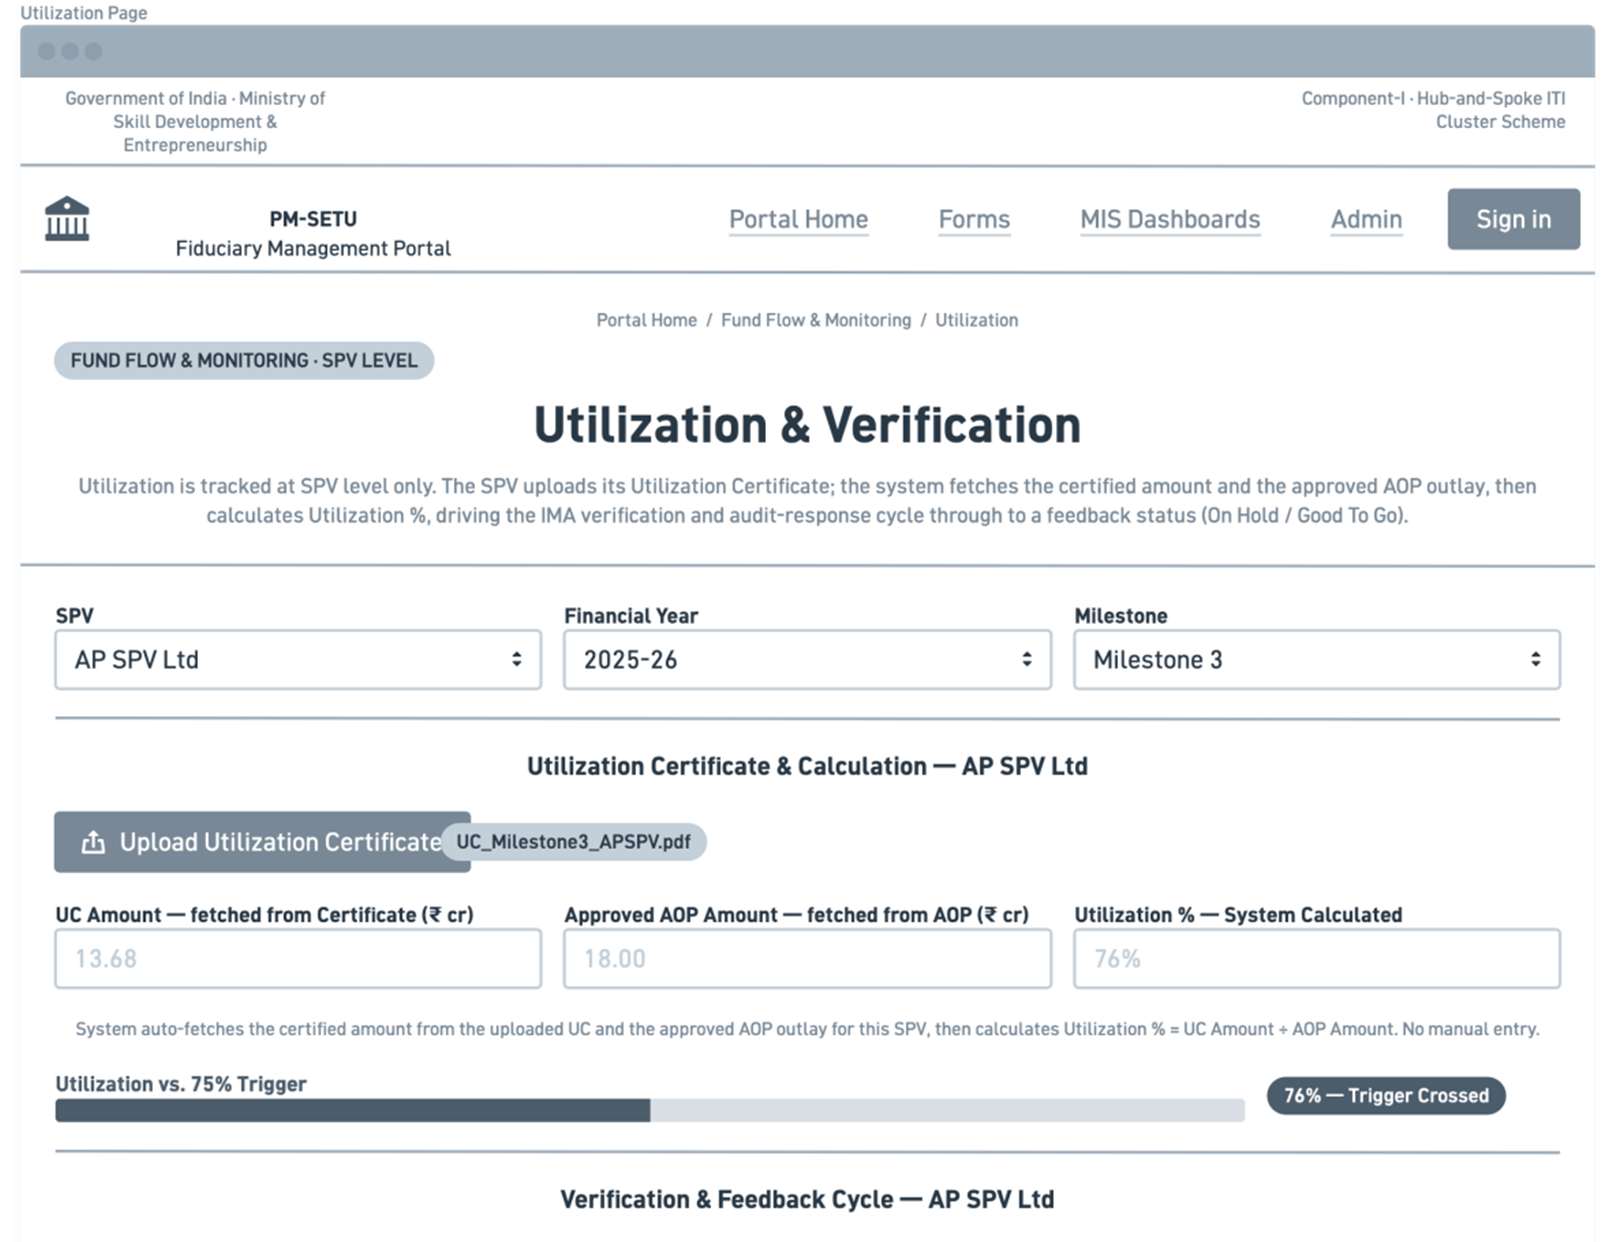
Fund flow process design and mockups
No caption in source
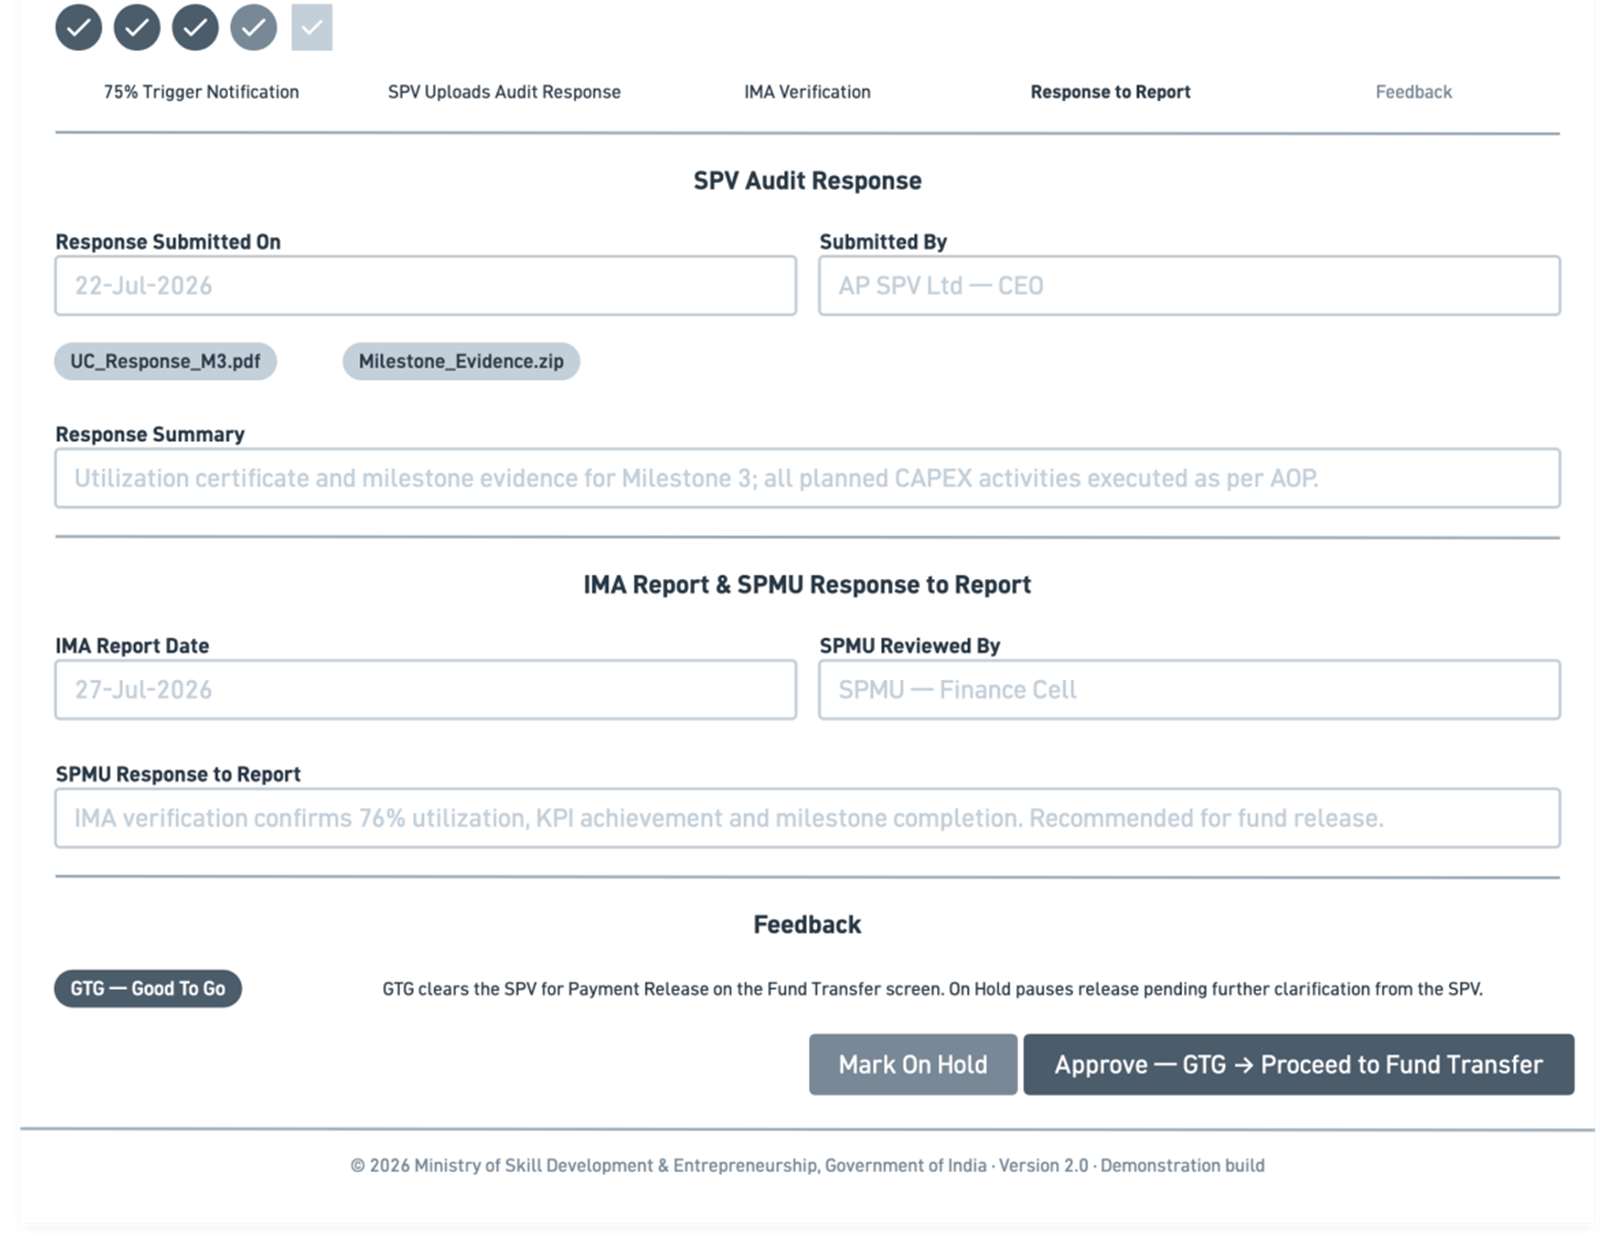
Fund flow process design and mockups
No caption in source
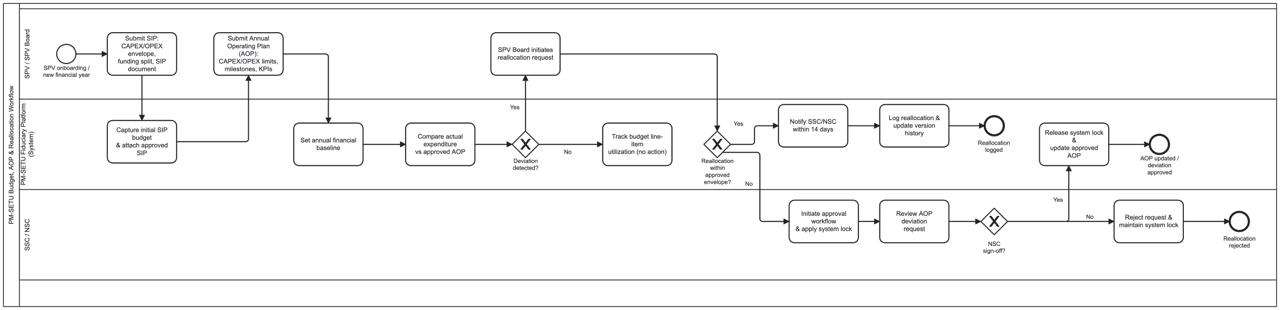
Budget and AOP process design and mockups
No caption in source
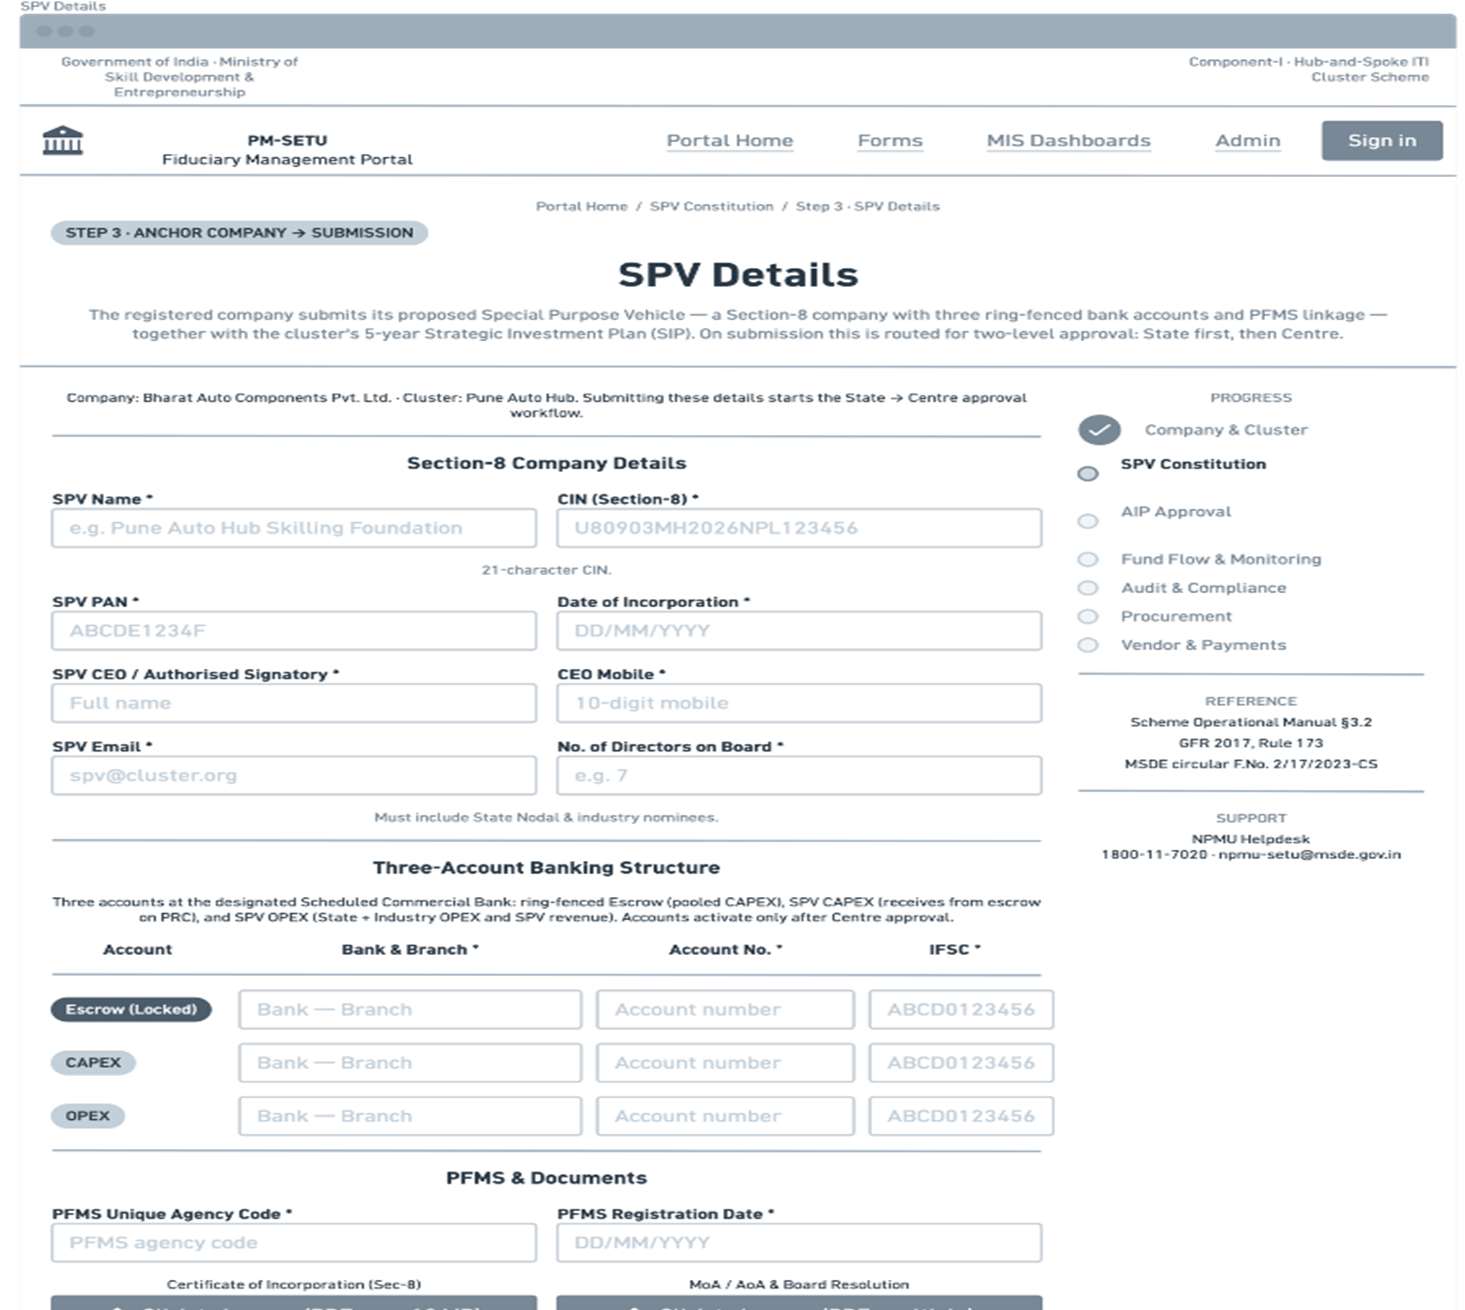
Budget and AOP process design and mockups
No caption in source
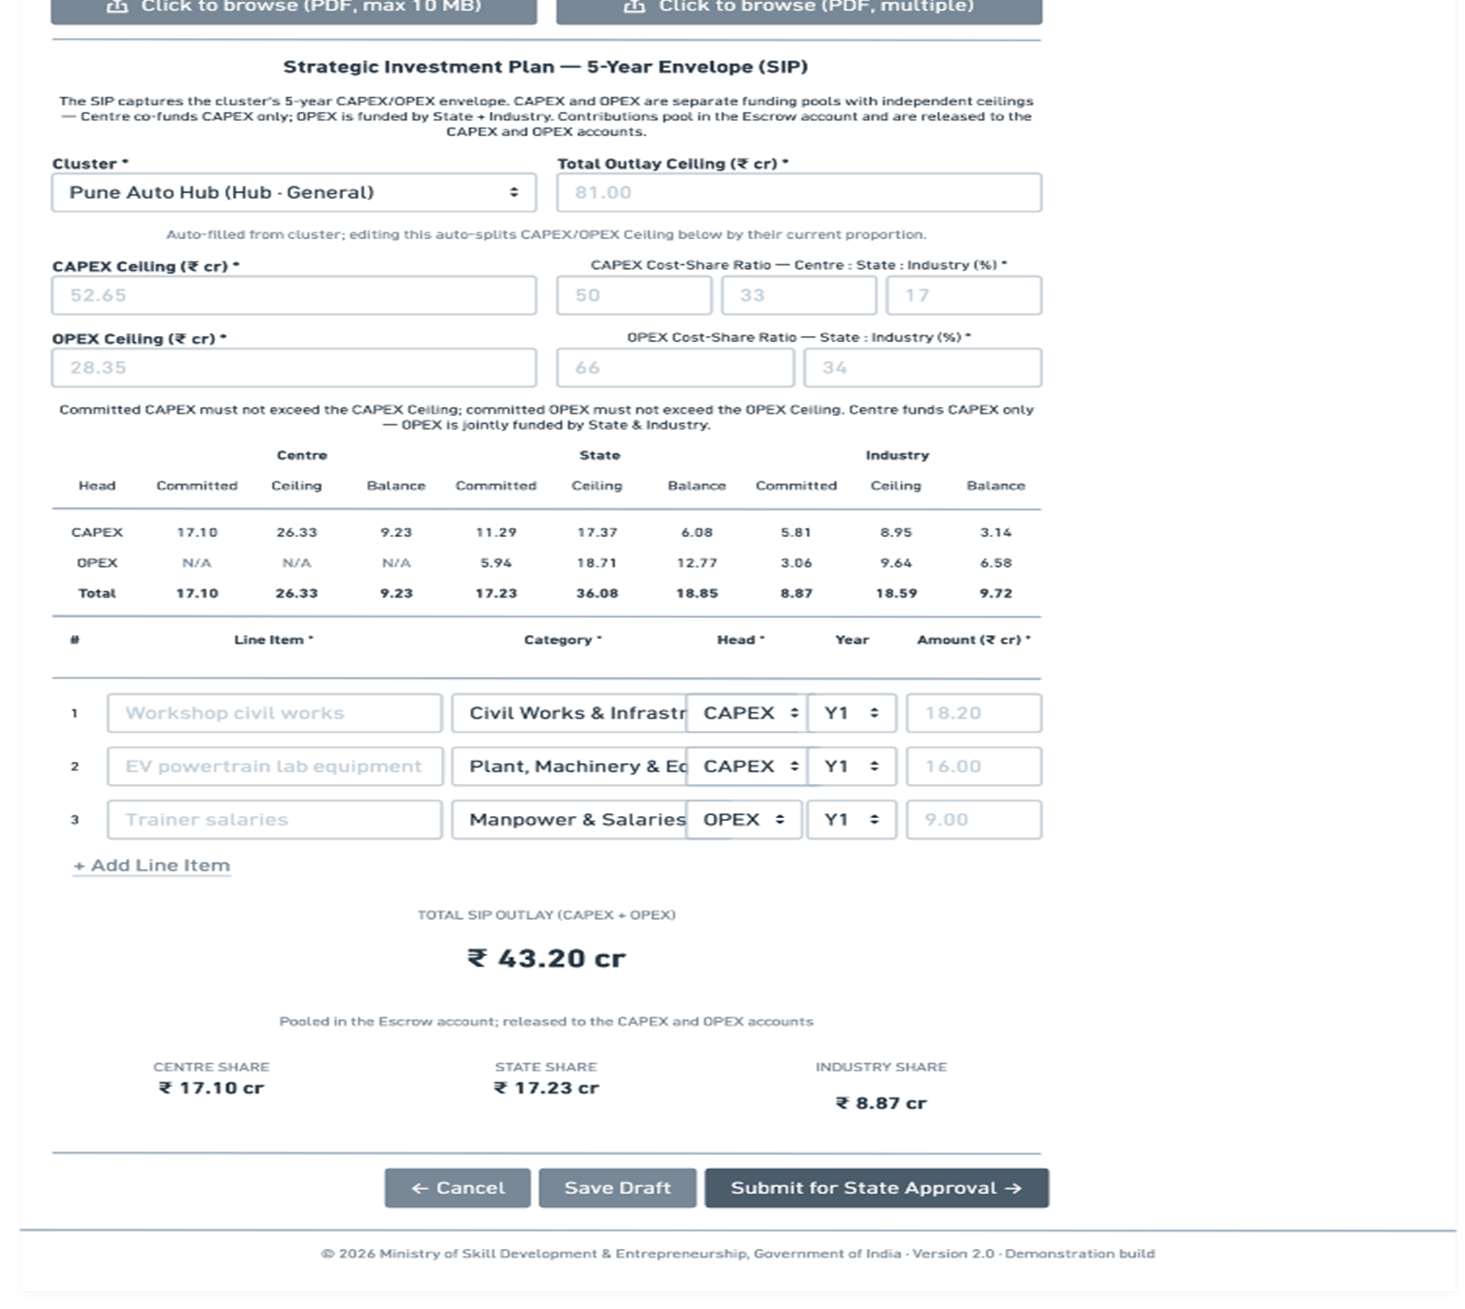
Budget and AOP process design and mockups
No caption in source
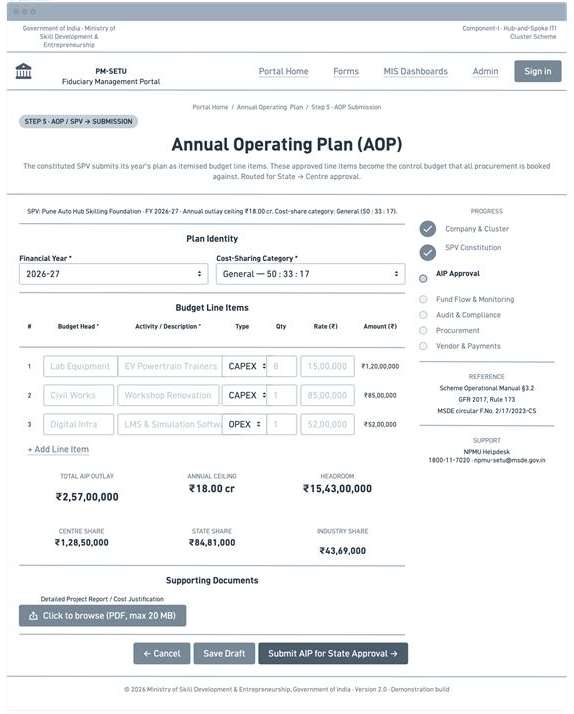
Budget and AOP process design and mockups
No caption in source
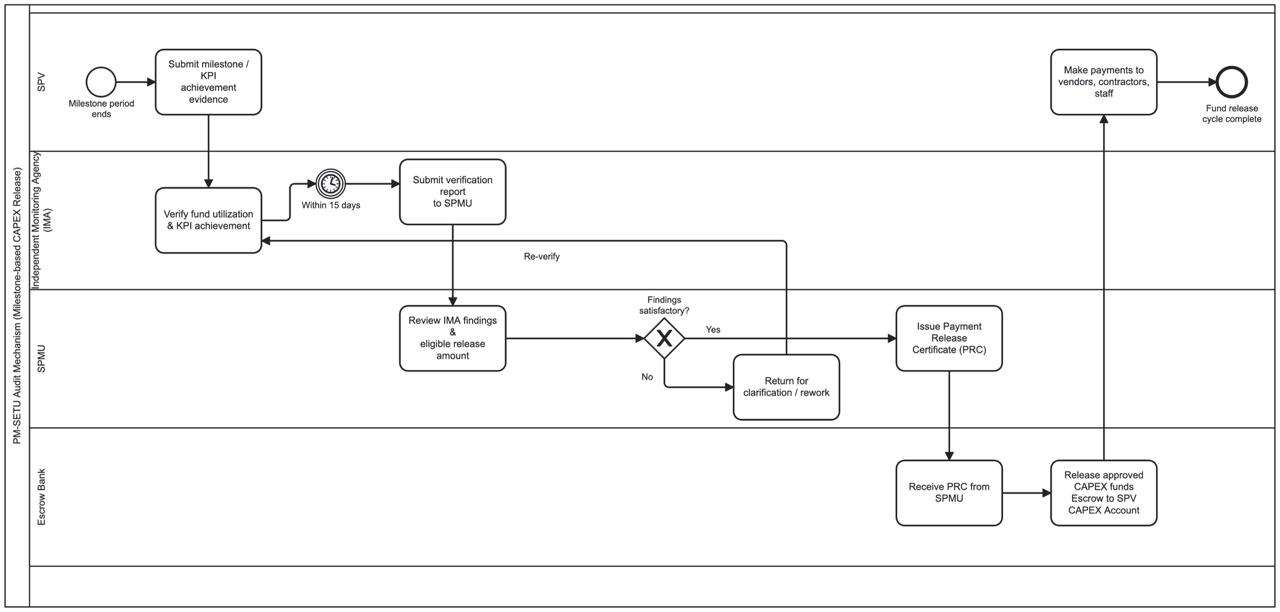
Audit process design
No caption in source
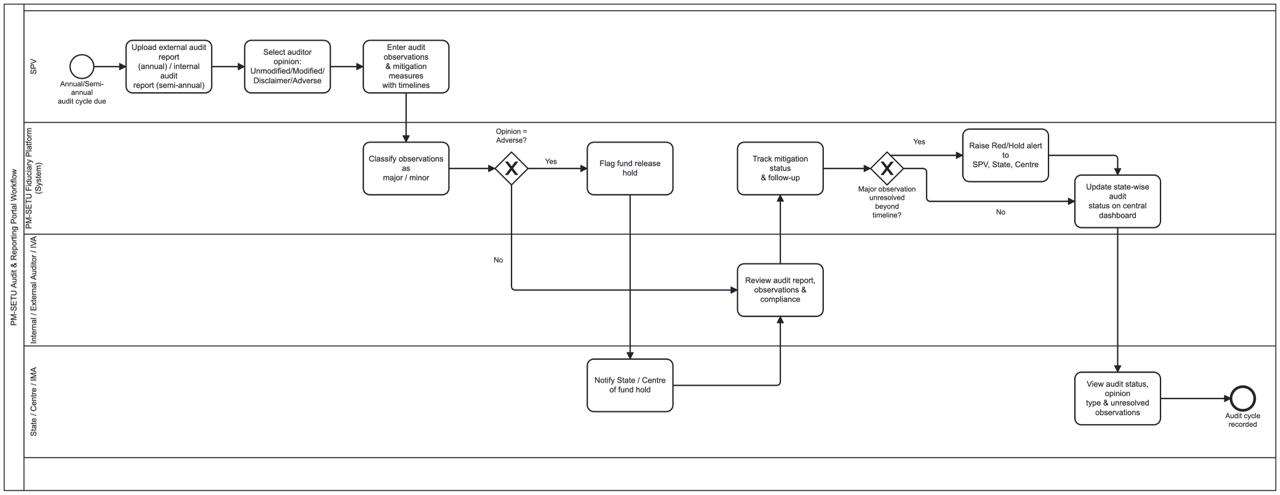
Audit process design
No caption in source
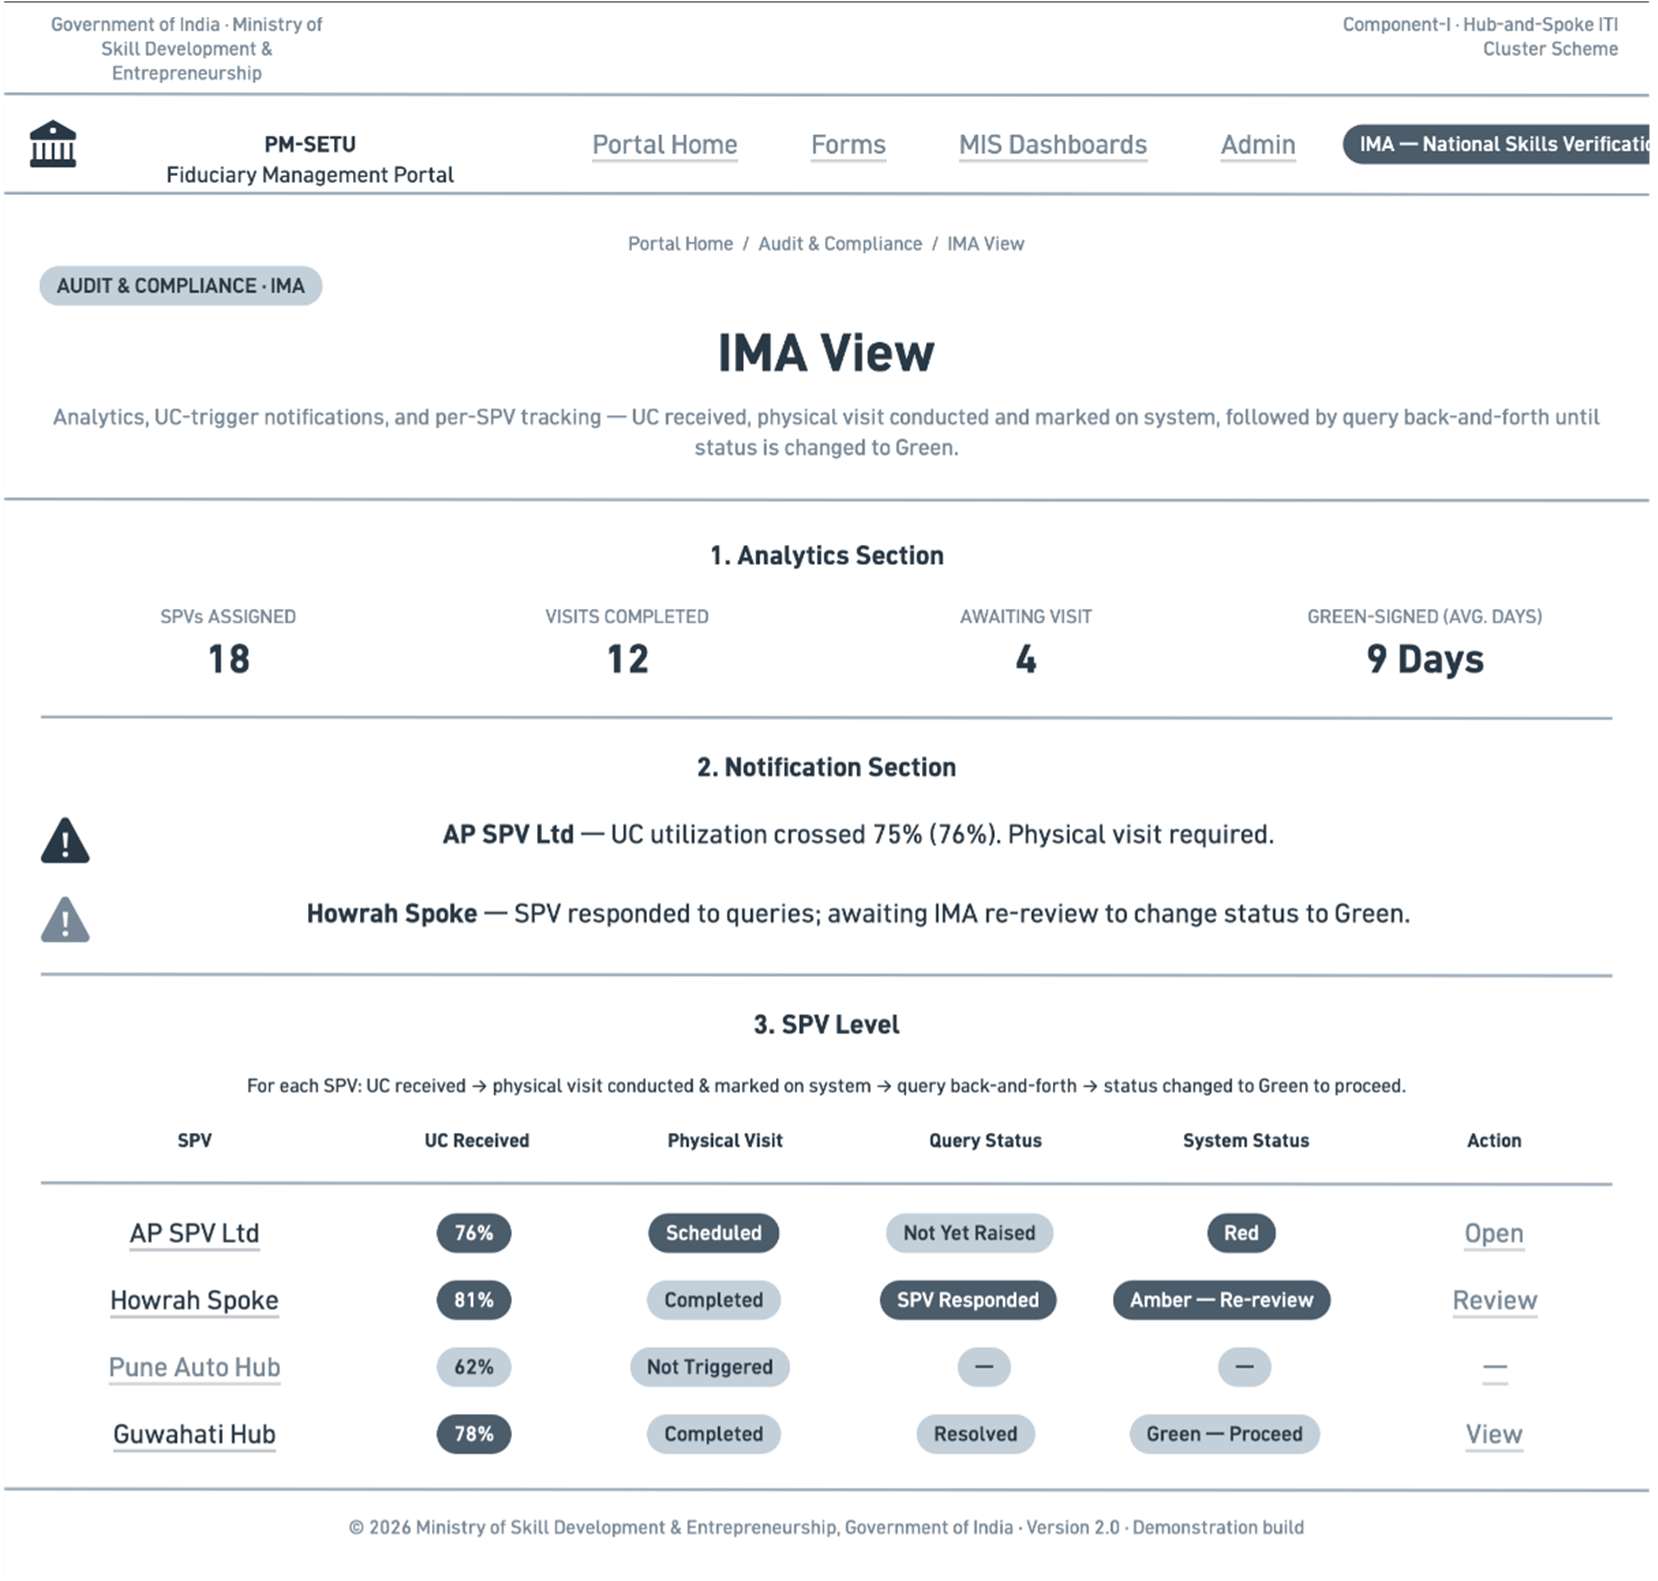
Audit process design
No caption in source
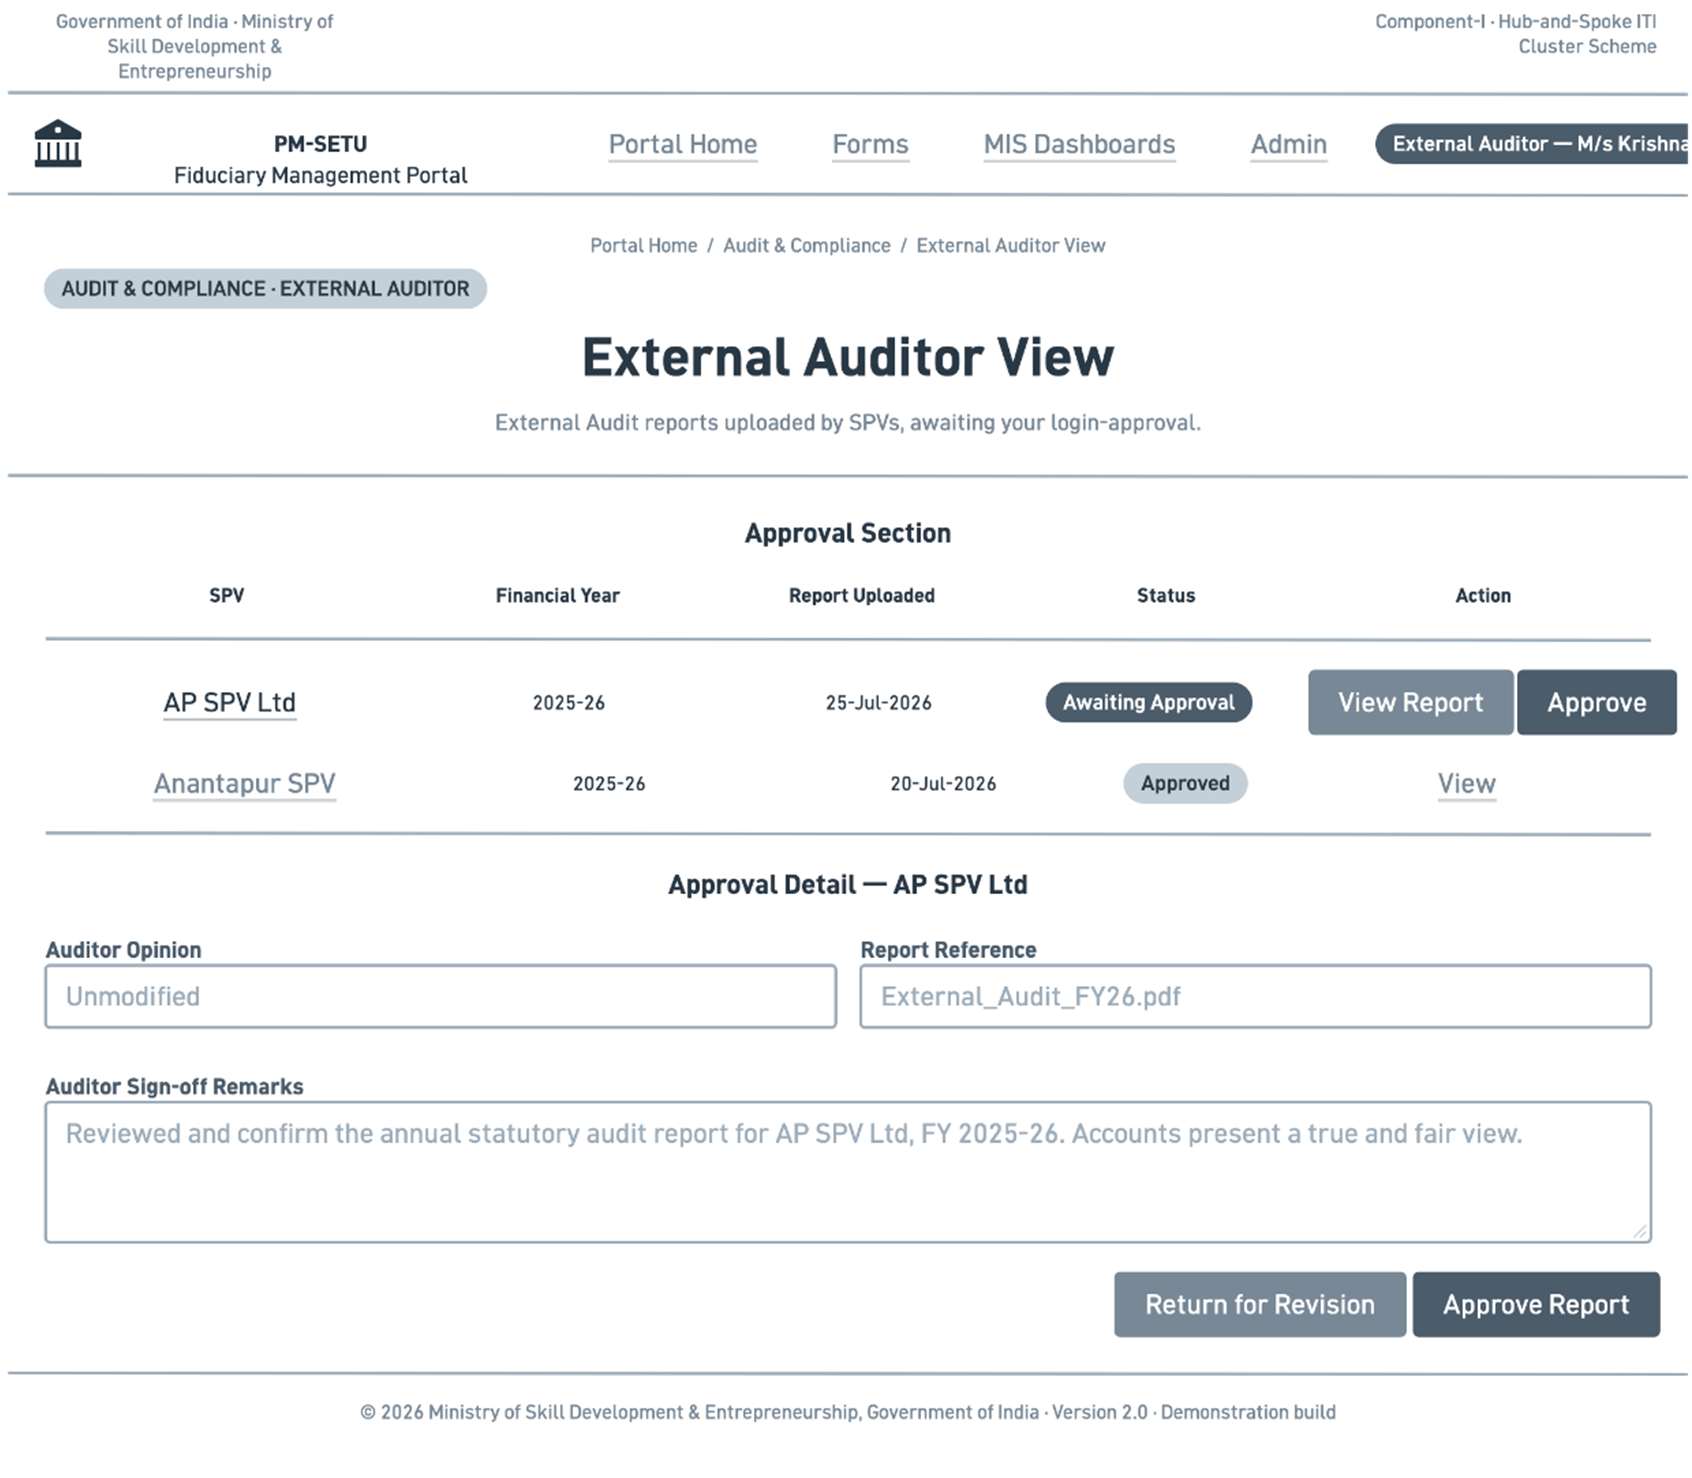
Audit process design
No caption in source
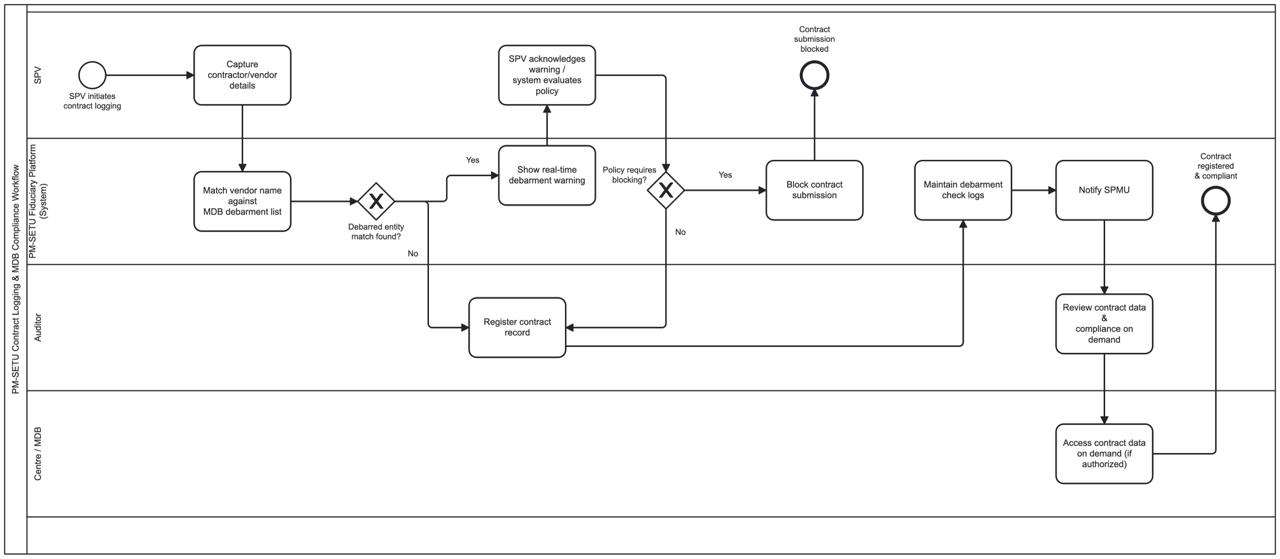
Contract management process design
No caption in source
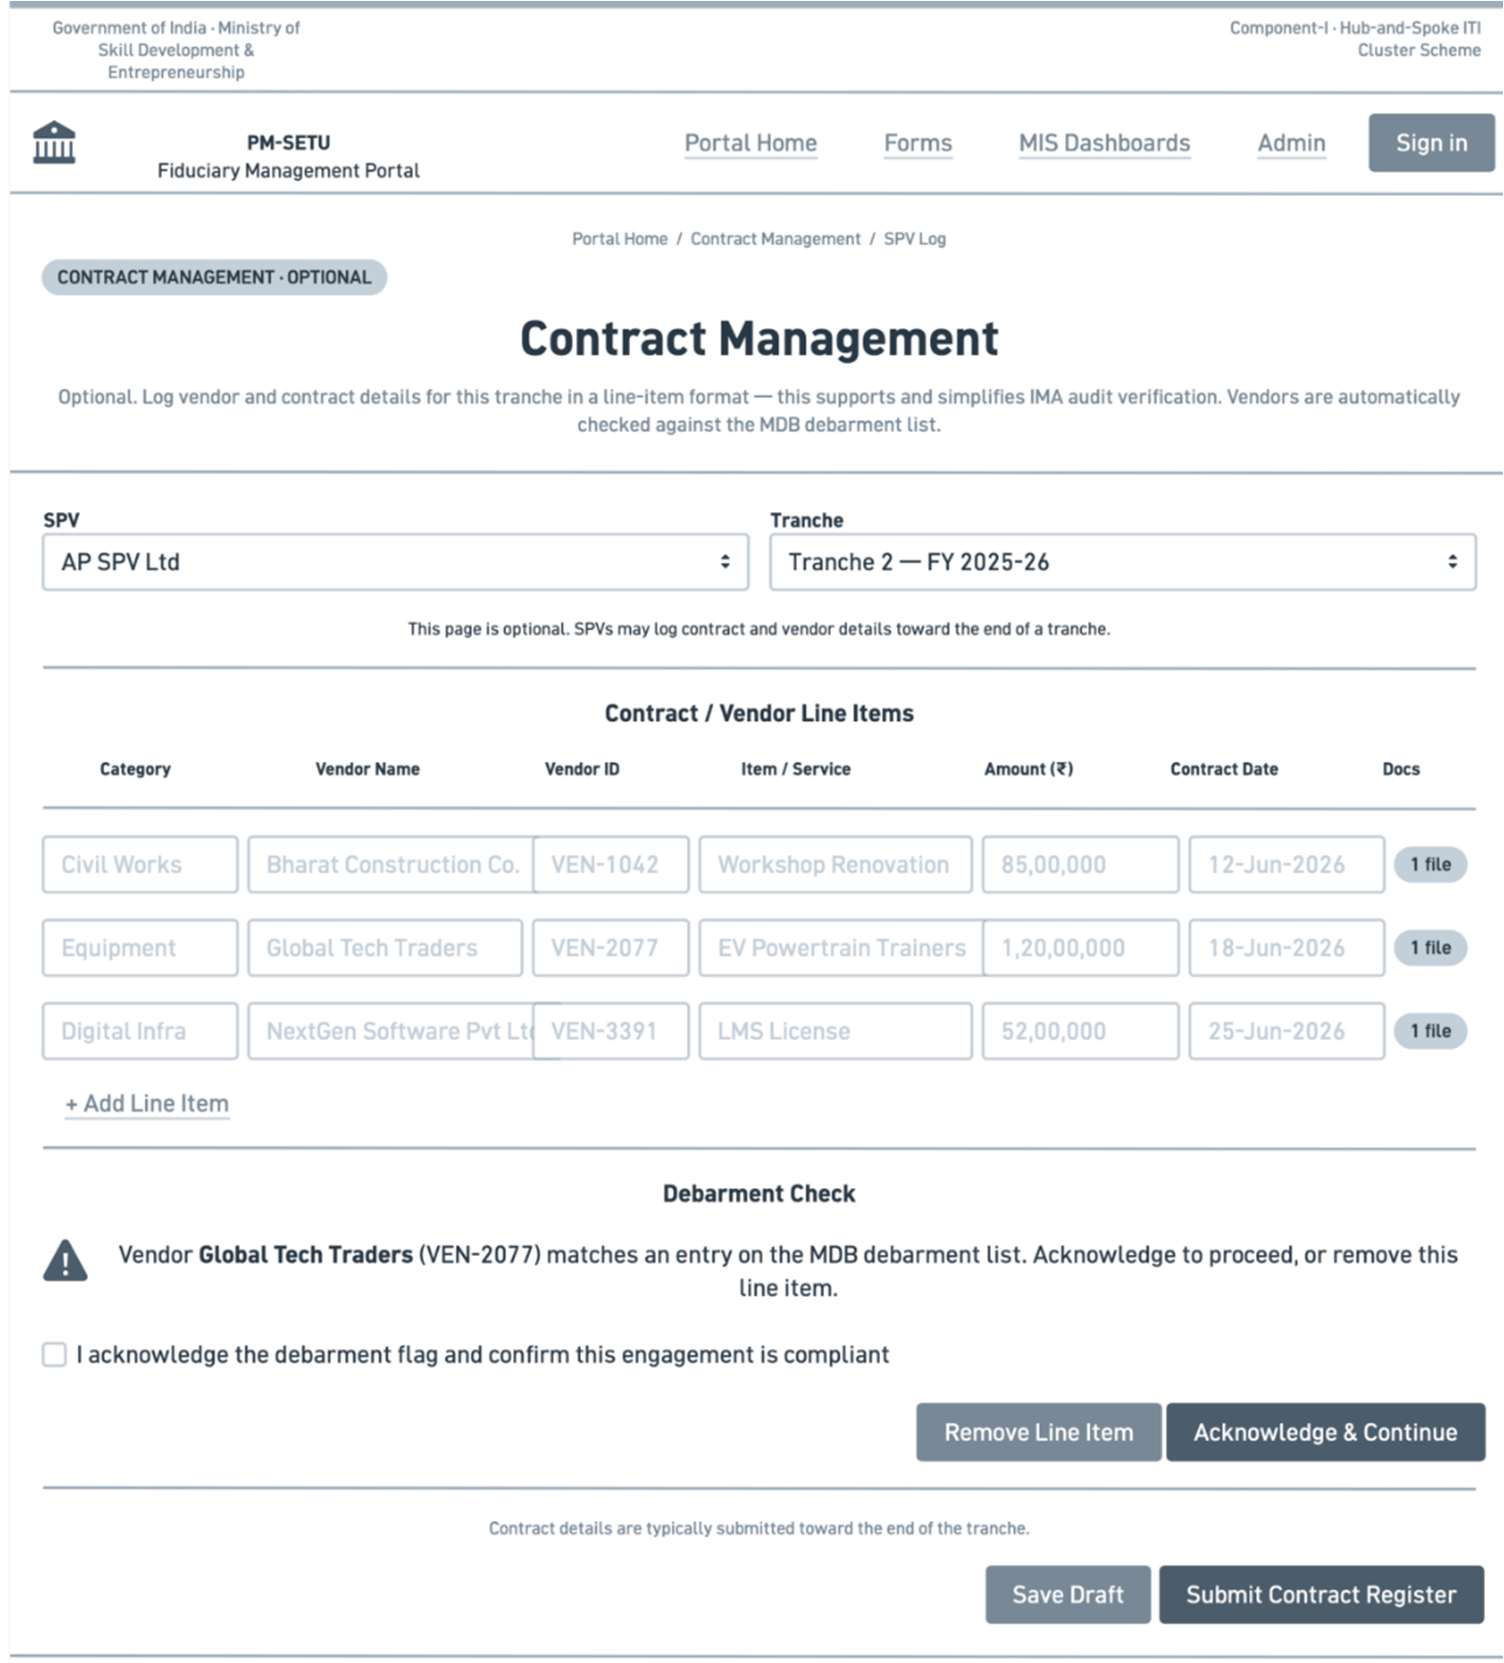
Contract management process design
No caption in source
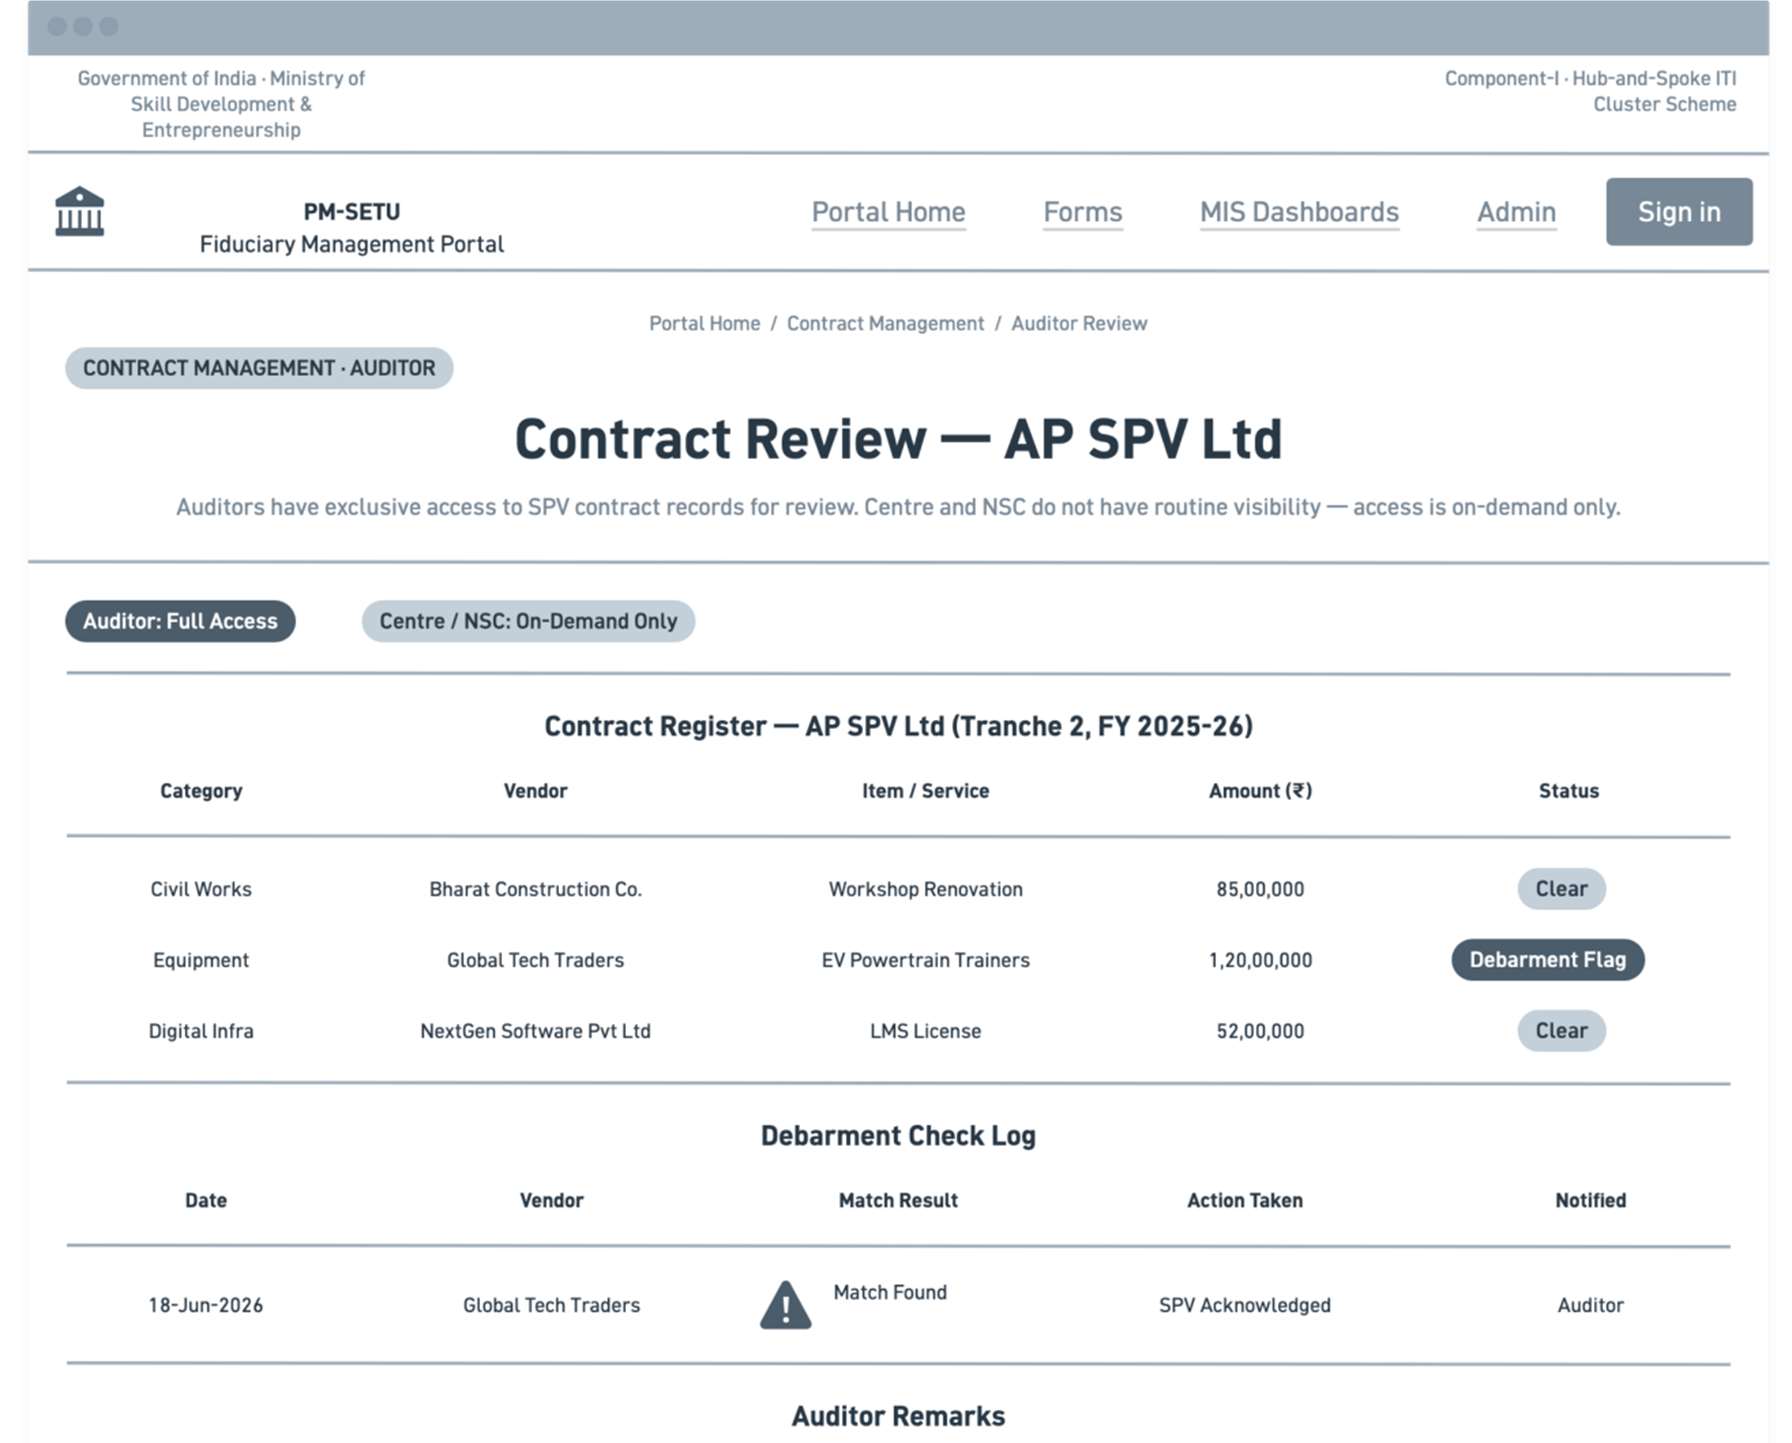
Contract management process design
No caption in source
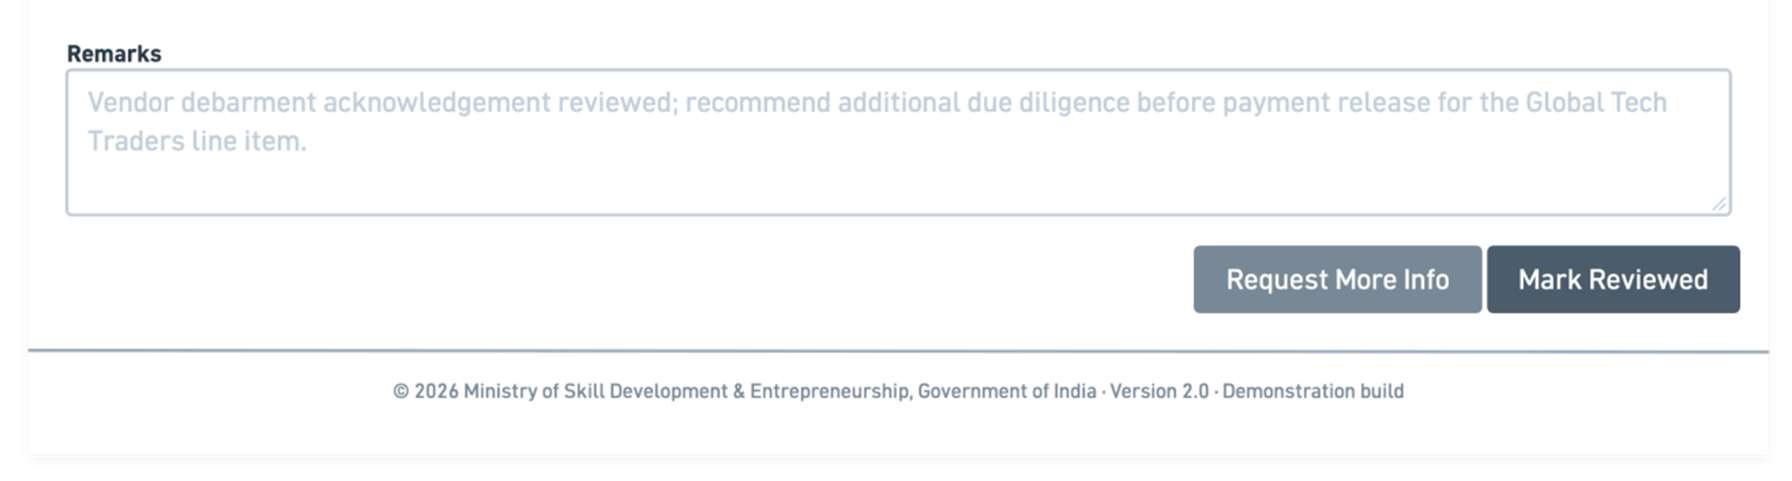
Contract management process design
No caption in source
Admin Management System (22 diagrams)
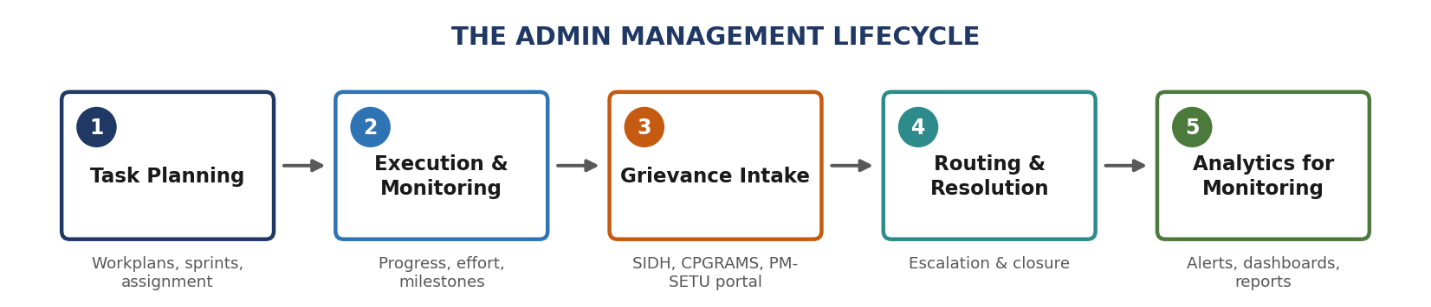
1. Overview
Figure 1 — The Admin Management lifecycle: from task planning and grievance intake through to routing, resolution, and analytics.
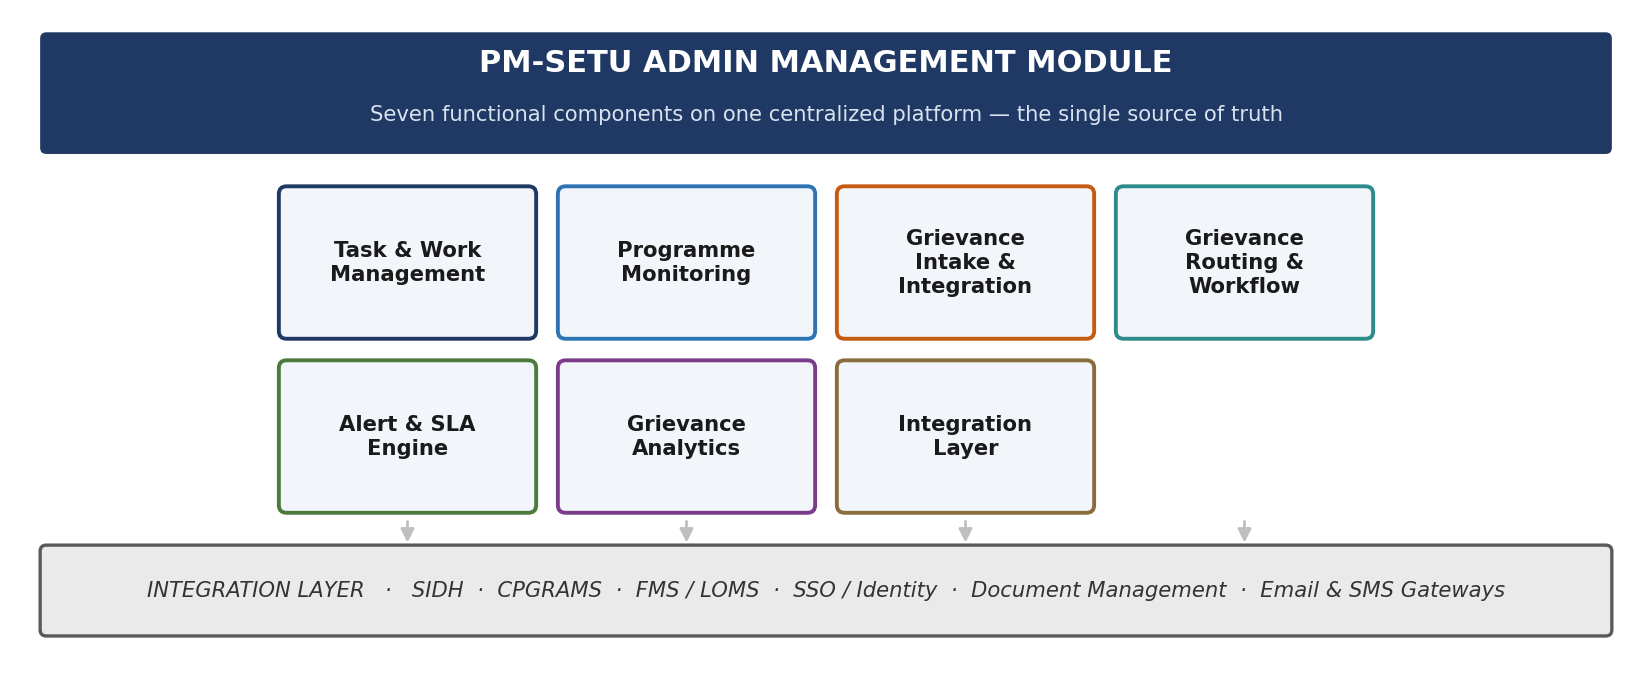
3. Business Requirements
Figure 2 — PM-SETU Admin Management Module: seven functional components on one centralized platform.
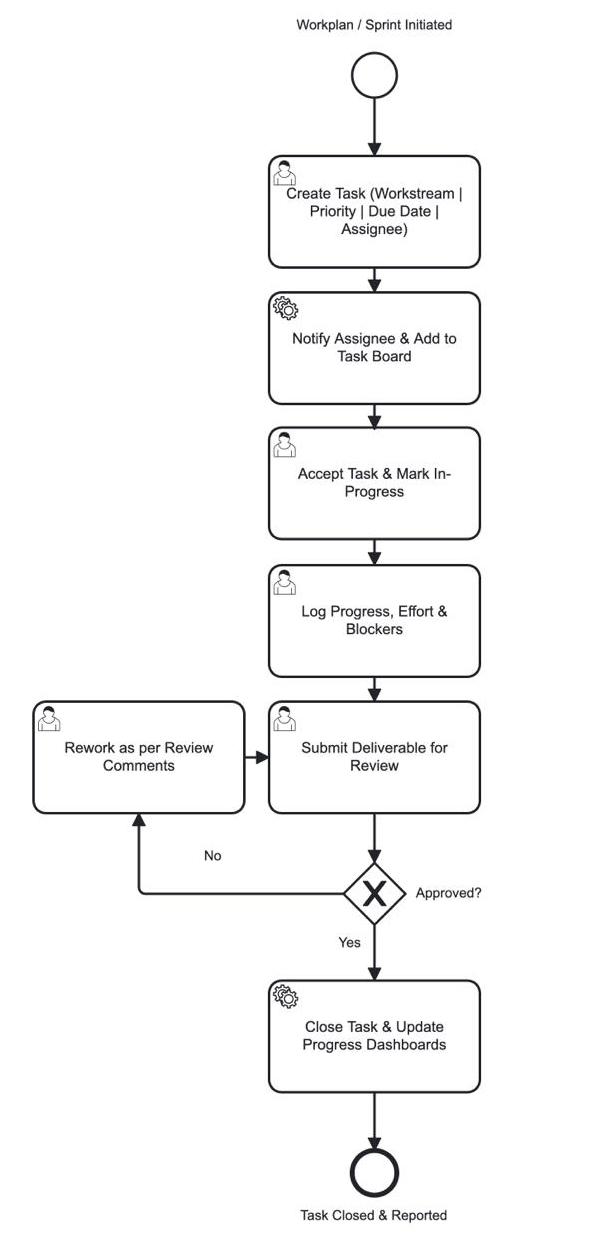
Sub-module 1: PM-SETU Project Management — user journey
No caption in source
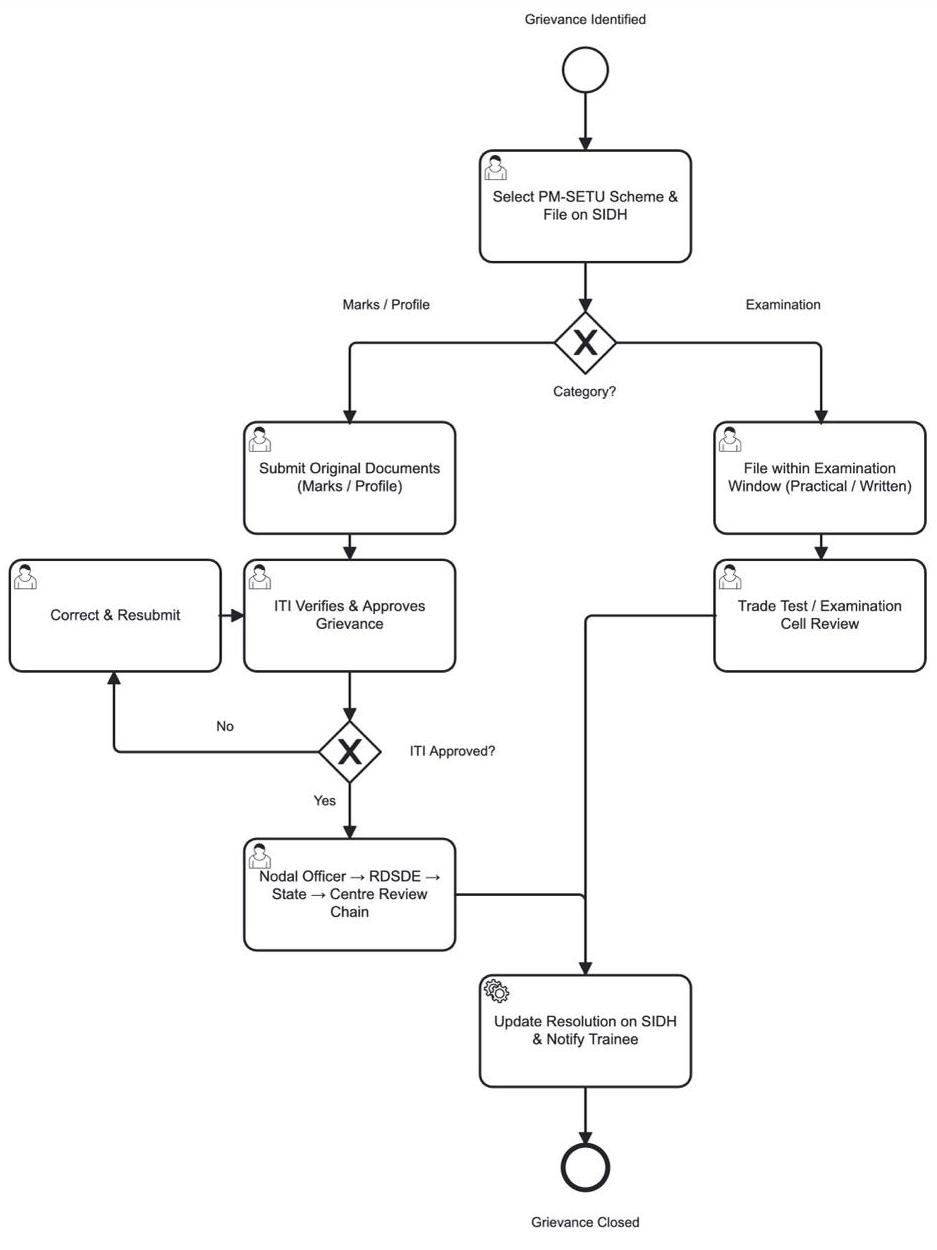
Trainee grievance journey (SIDH)
No caption in source
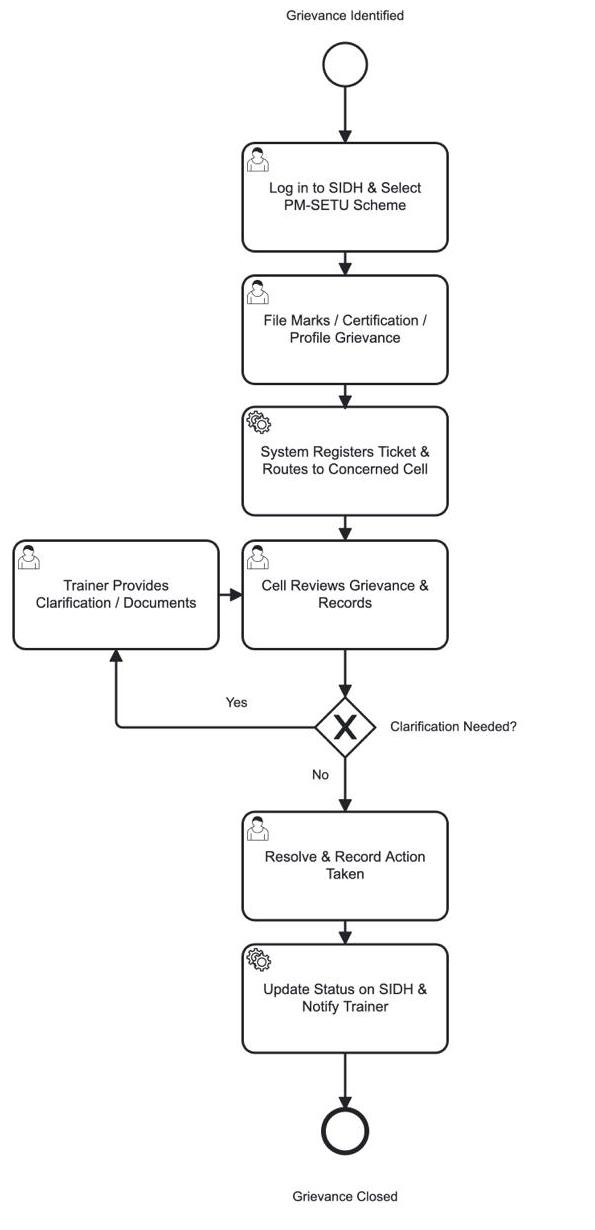
Trainer grievance journey (SIDH)
No caption in source
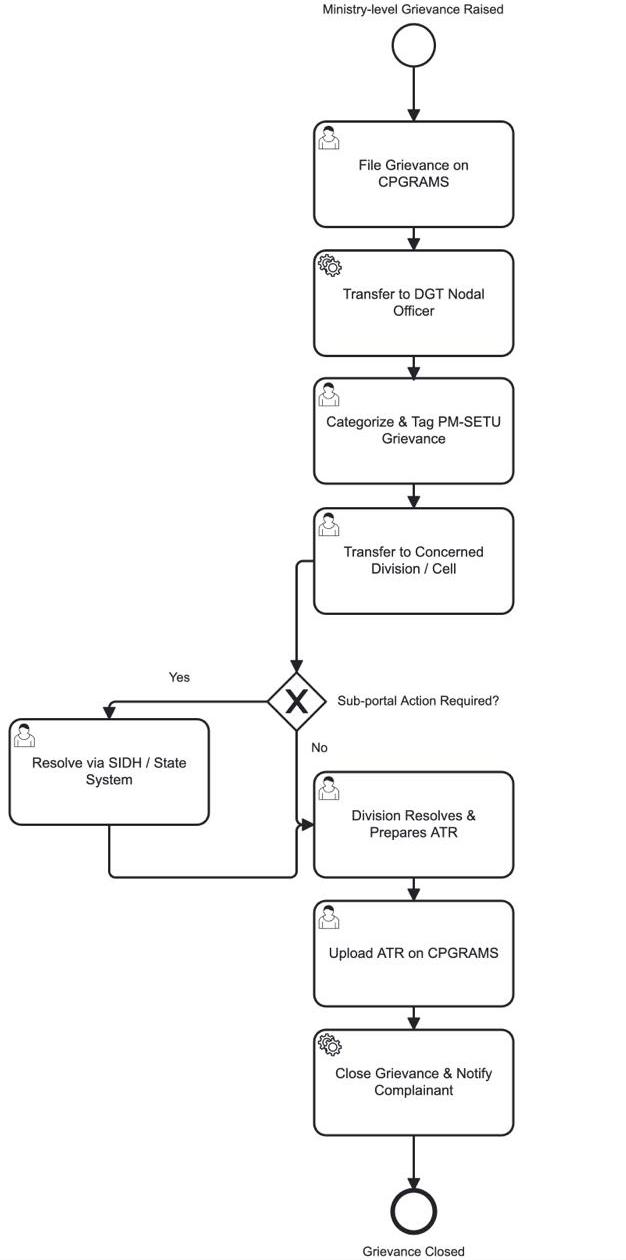
Ministry-level grievance journey (CPGRAMS)
No caption in source
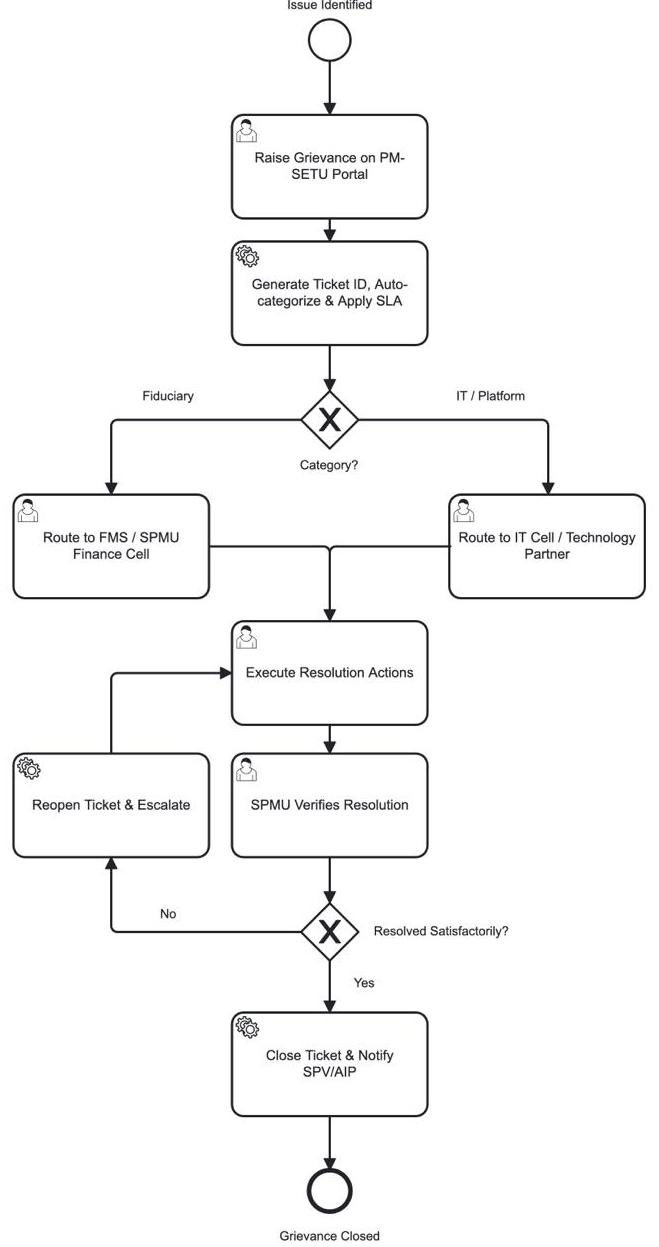
SPV/AIP grievance journey (PM-SETU portal)
No caption in source
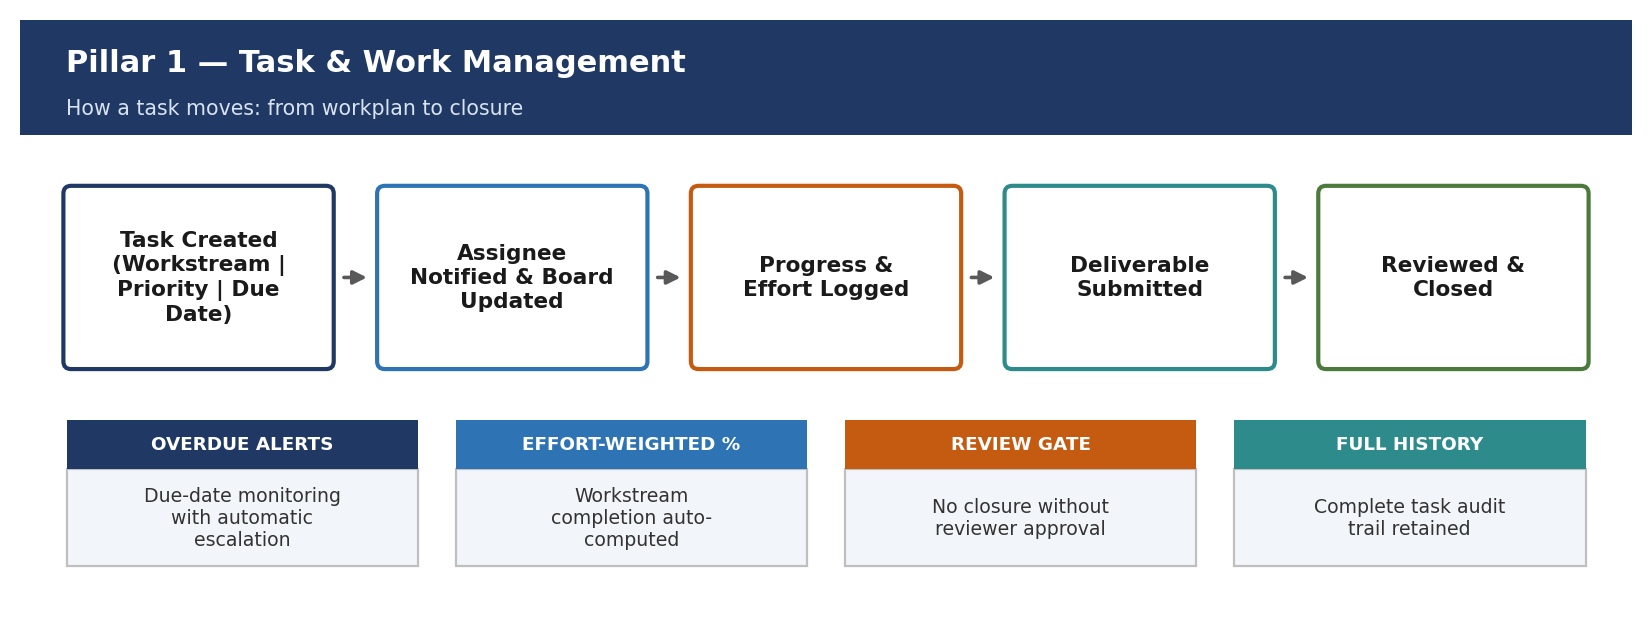
Pillar 1: Task & work management
Figure 8 — Pillar 1: Task & Work Management — from workplan to closure.
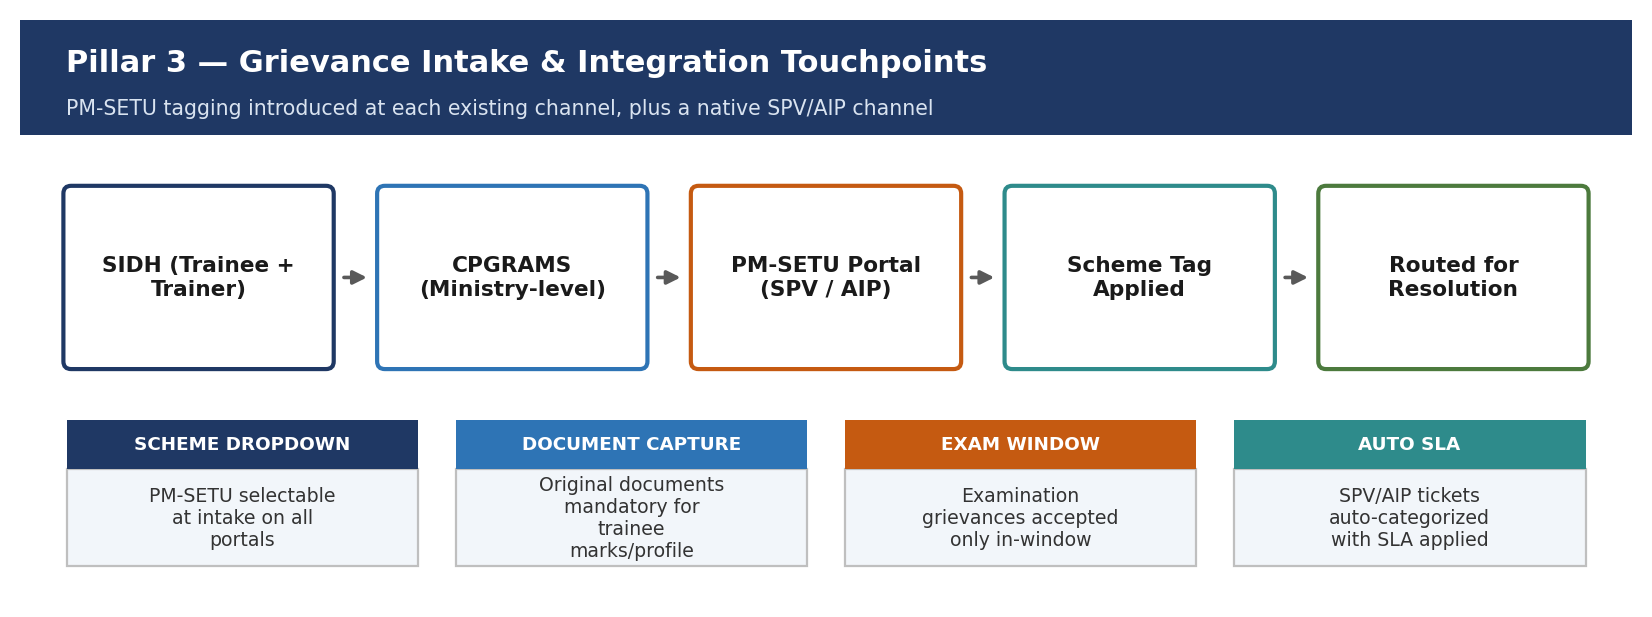
Pillar 3: Grievance intake & PM-SETU integration touchpoints
Figure 9 — Pillar 3: Grievance Intake & Integration Touchpoints — PM-SETU tagging at every channel.
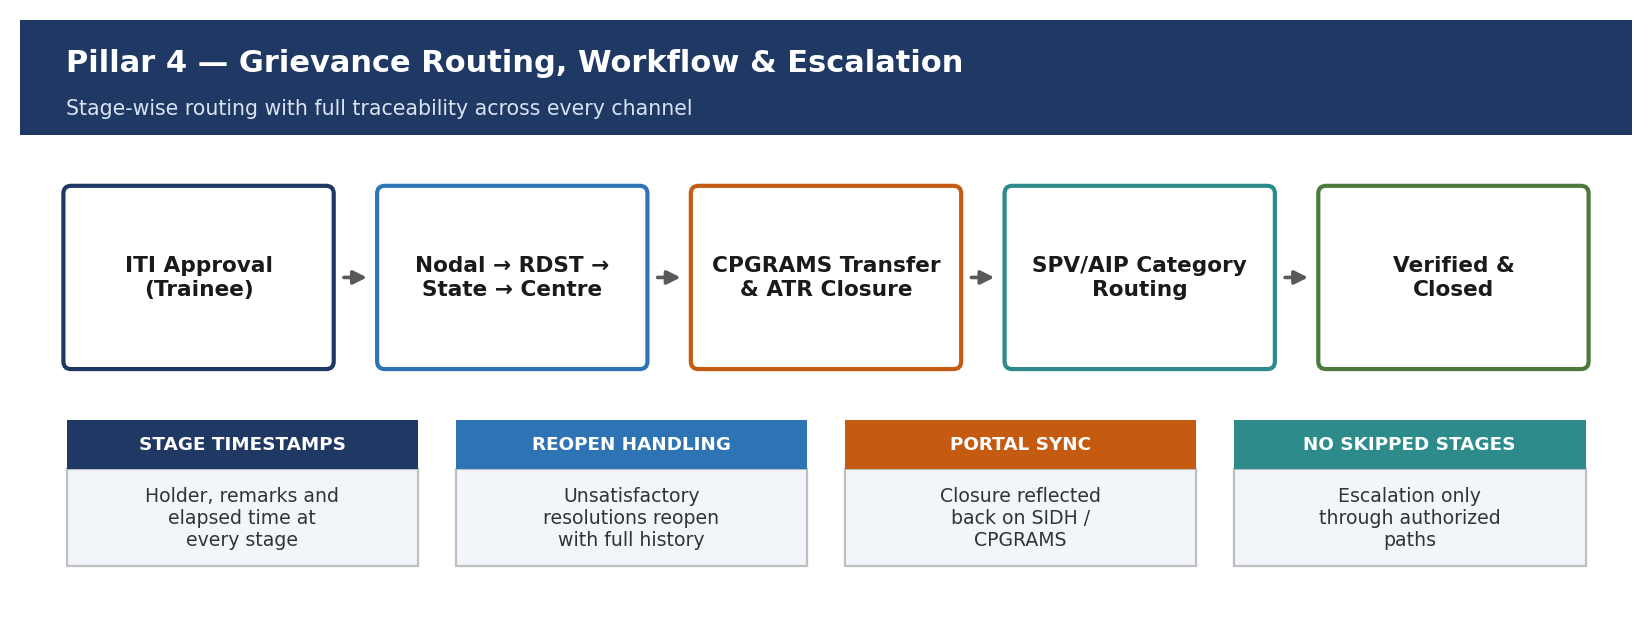
Pillar 4: Grievance routing, workflow & escalation
Figure 10 — Pillar 4: Grievance Routing, Workflow & Escalation — stage-wise traceability across every channel.
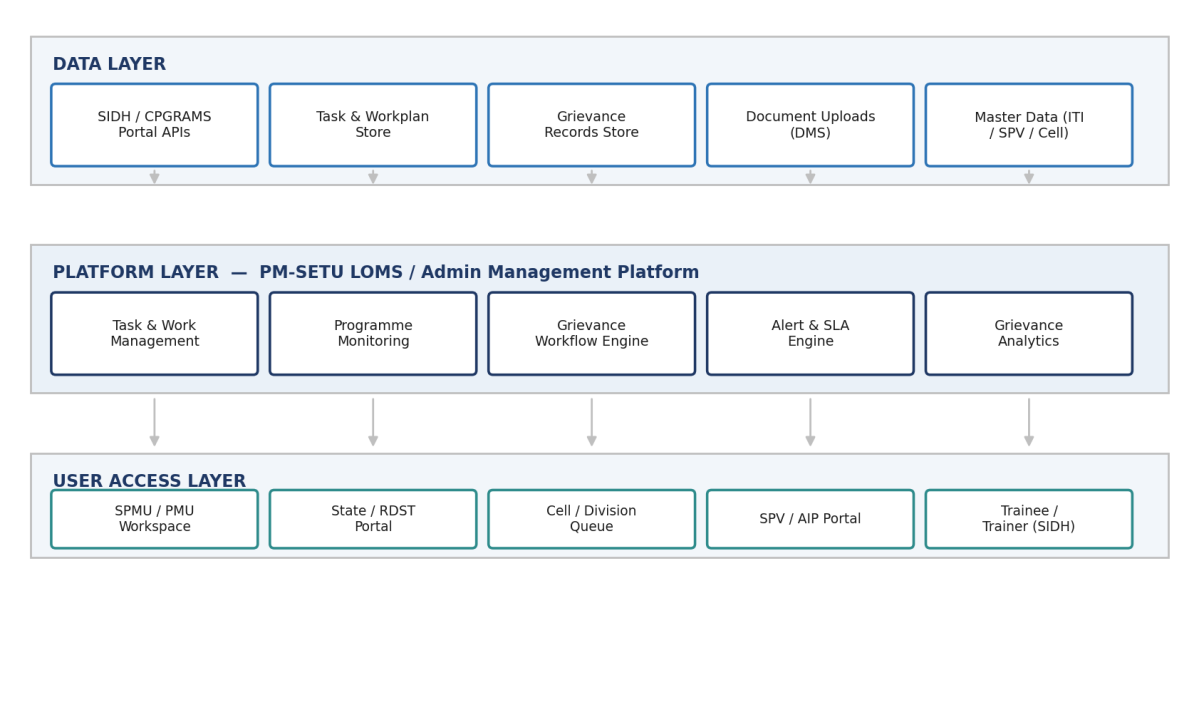
5. Solution Architecture
Figure 11 — Three-tier solution architecture: Data, Platform, and User Access layers.
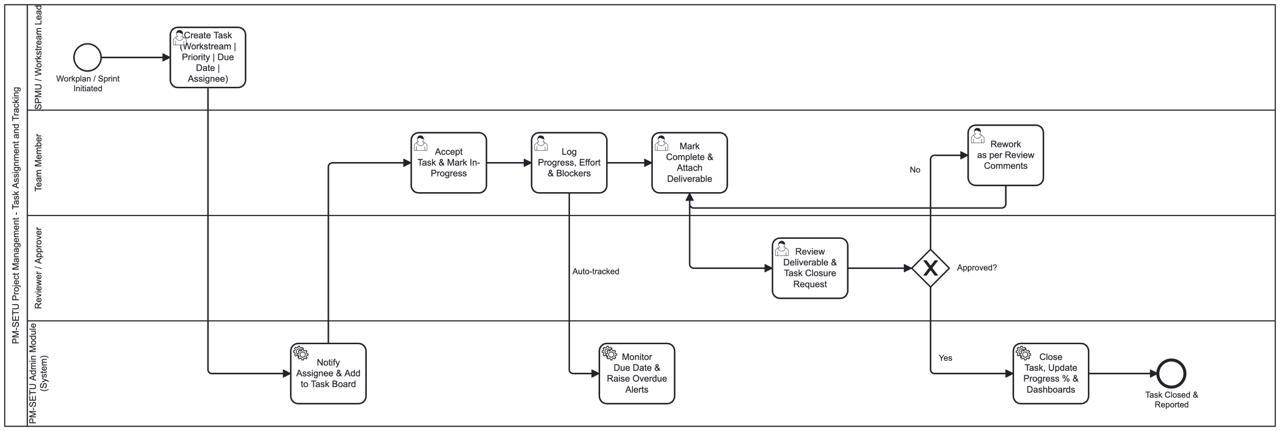
PM-SETU Project Management — task assignment and tracking
Figure 12 — Process design: PM-SETU Project Management task assignment and tracking
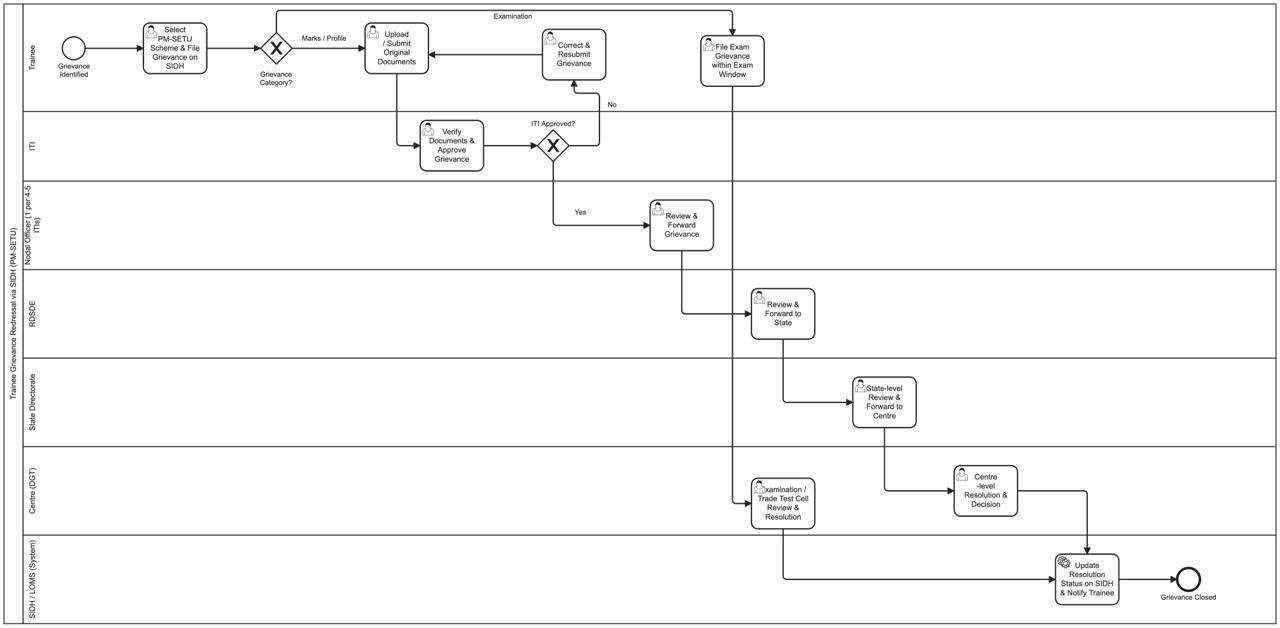
Trainee grievance redressal via SIDH — marks and profile category
Figure 13 — Process design: Trainee grievance redressal via SIDH, marks and profile category
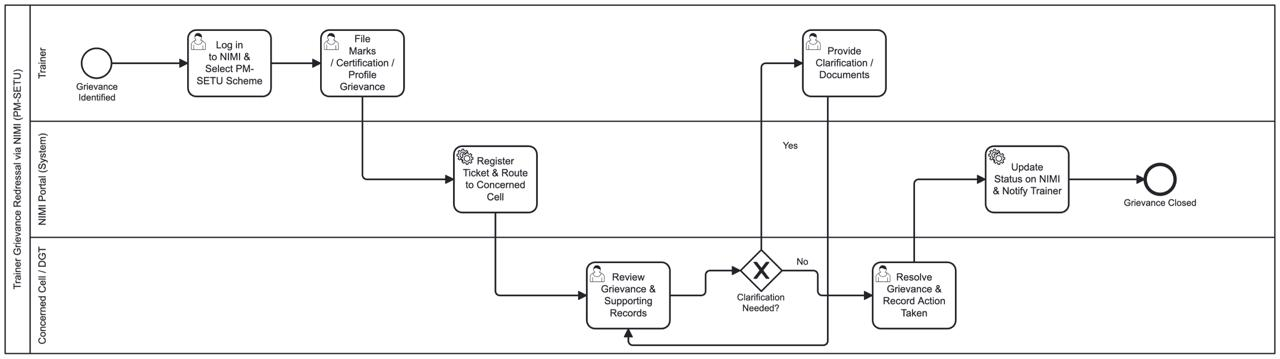
Trainer grievance redressal via SIDH
Figure 14 — Process design: Trainer grievance redressal via SIDH
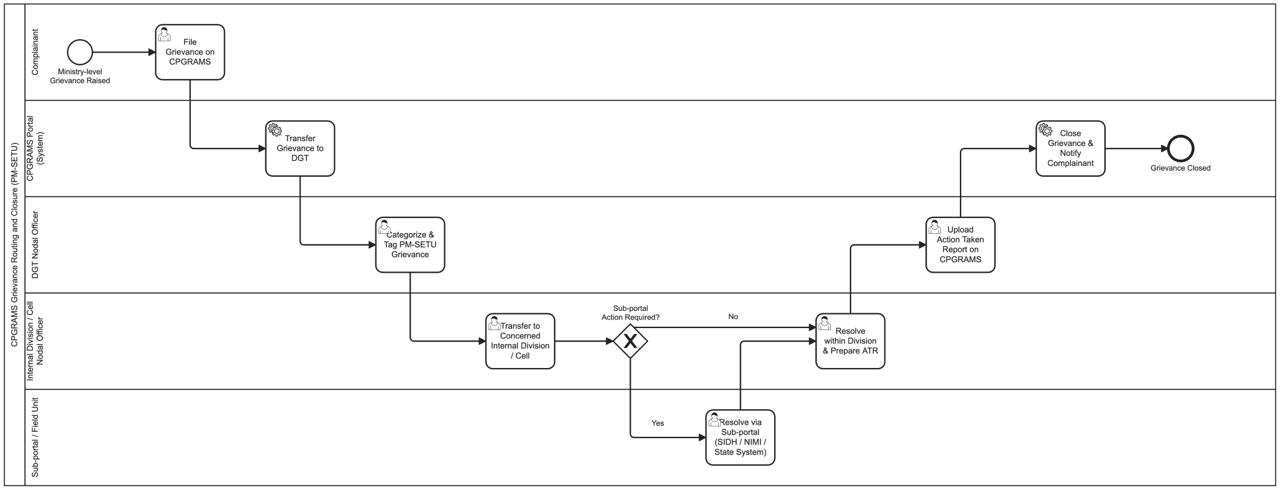
CPGRAMS grievance routing and closure
Figure 15 — Process design: CPGRAMS grievance routing and closure
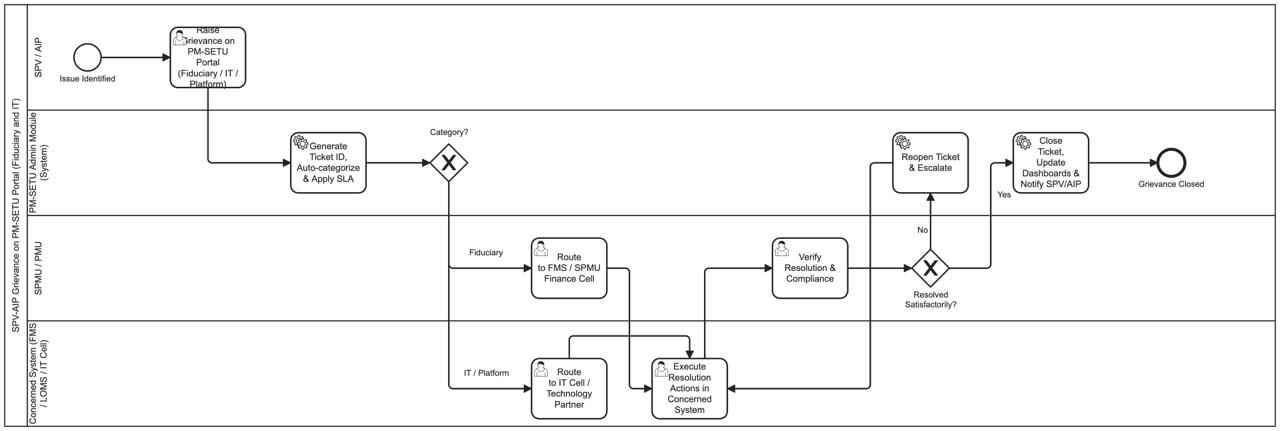
SPV/AIP grievance on the PM-SETU portal — fiduciary and IT
Figure 16 — Process design: SPV/AIP grievance on the PM-SETU portal, fiduciary and IT
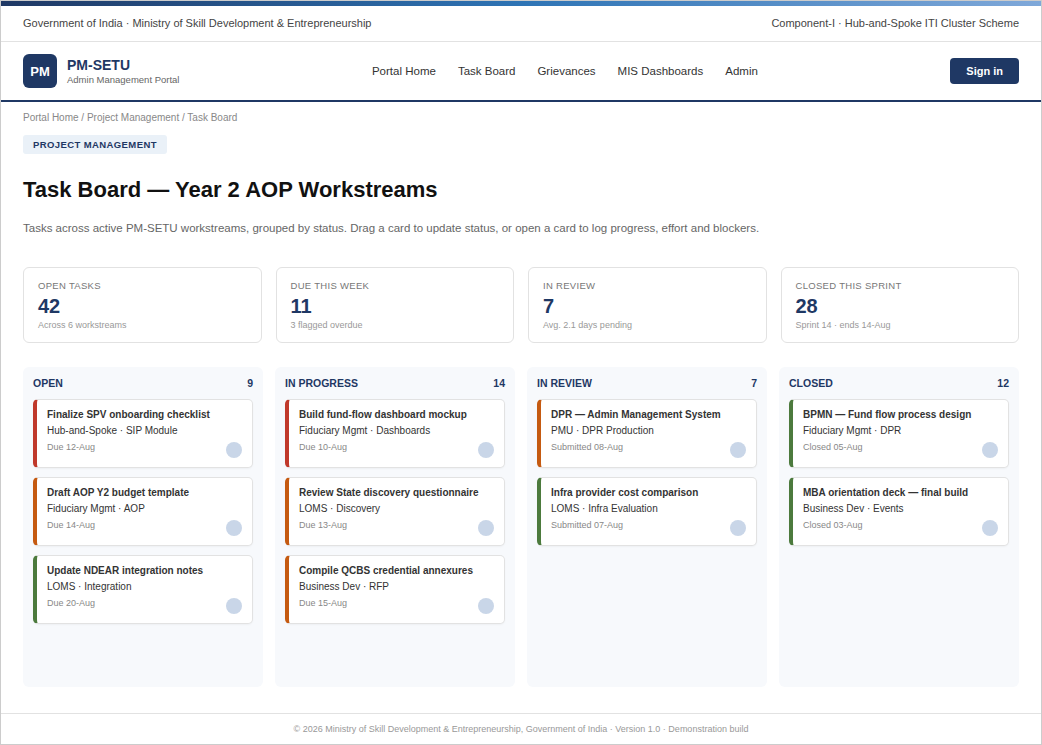
Task Board (Kanban view)
Figure 17 — Mockup: PM-SETU Project Management task board.
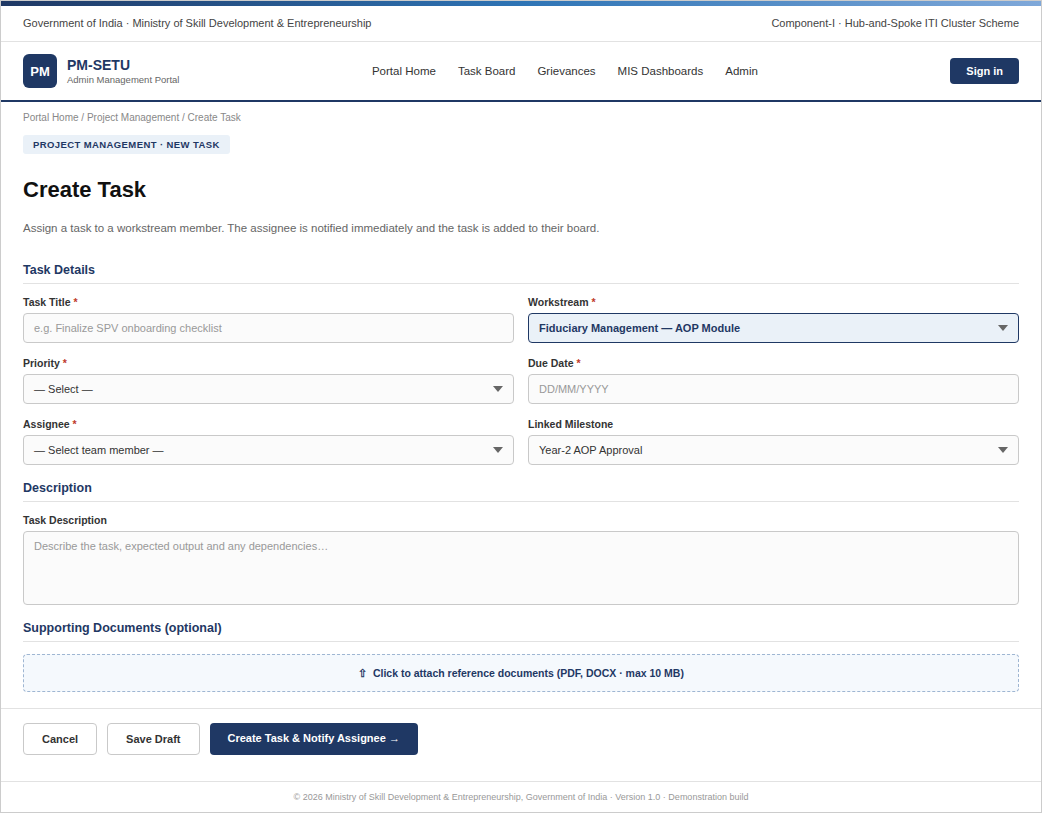
Task Creation form
Figure 18 — Mockup: Task creation form with workstream, priority, and assignee capture.
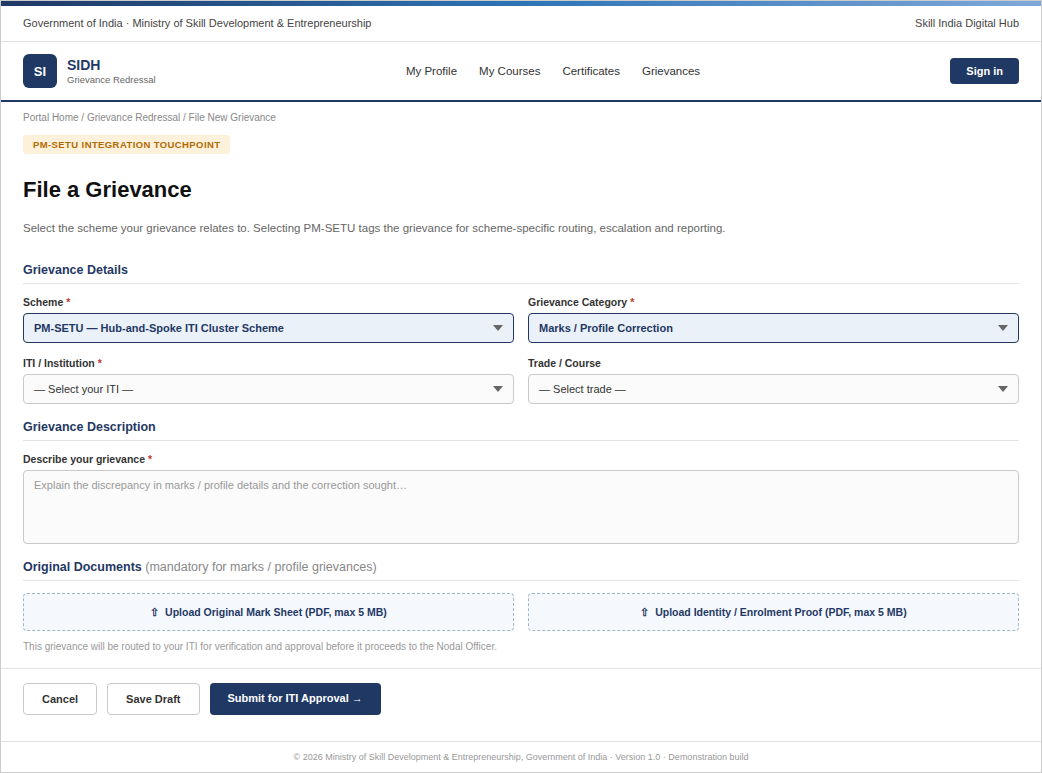
SIDH — Grievance filing with PM-SETU scheme dropdown
Figure 19 — Mockup: SIDH grievance filing screen showing the PM-SETU integration touchpoint (scheme dropdown).
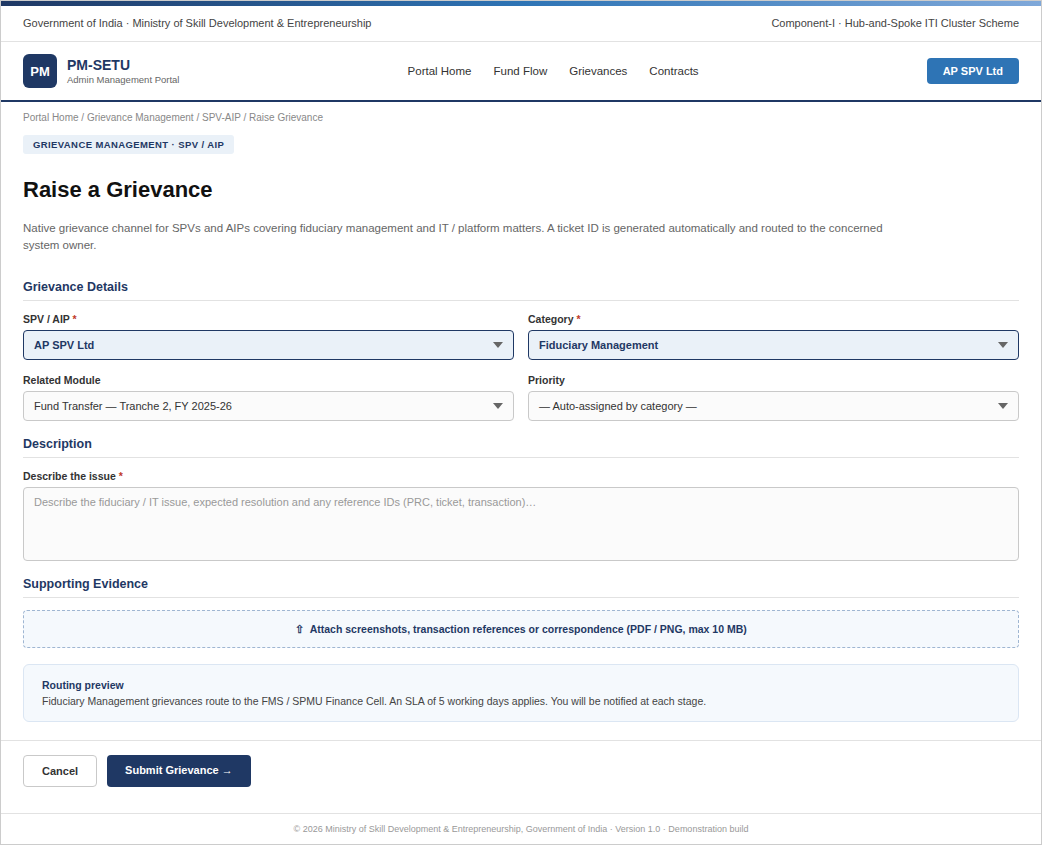
PM-SETU Portal — SPV/AIP grievance filing
Figure 20 — Mockup: Native SPV/AIP grievance filing screen on the PM-SETU portal.
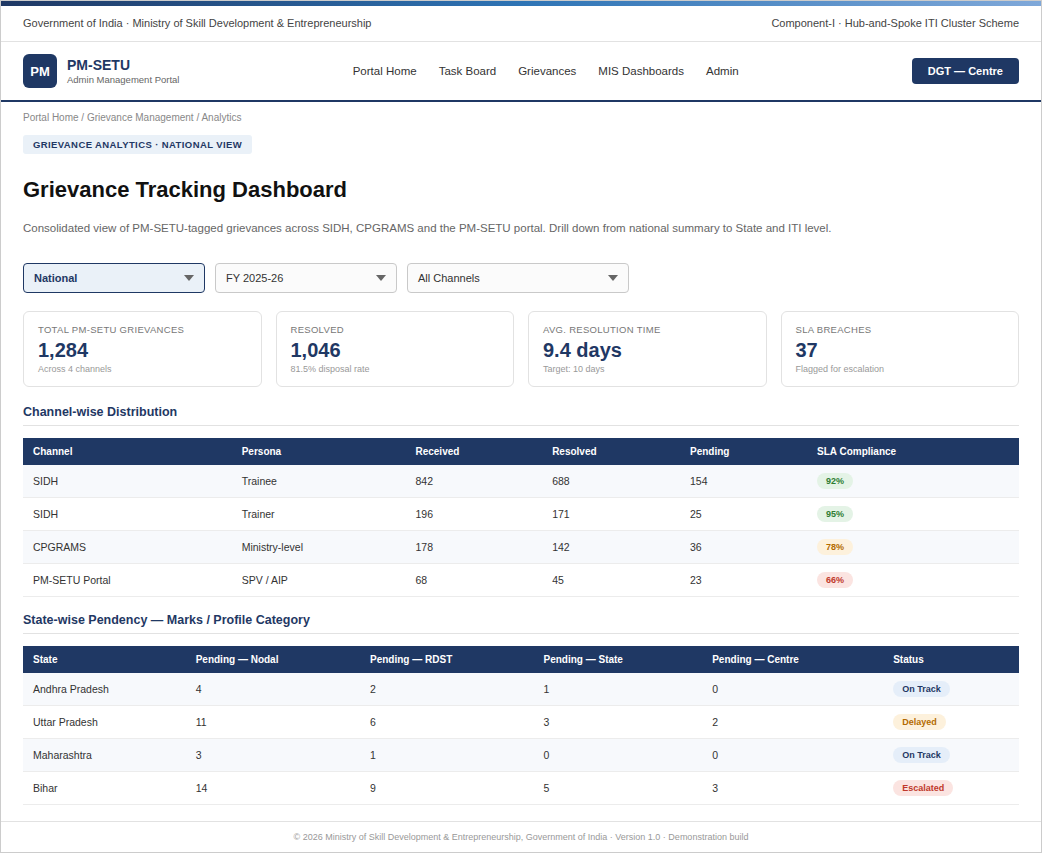
Grievance Tracking Dashboard (National view)
Figure 21 — Mockup: Consolidated grievance tracking dashboard, National view with channel and State-wise breakdowns.
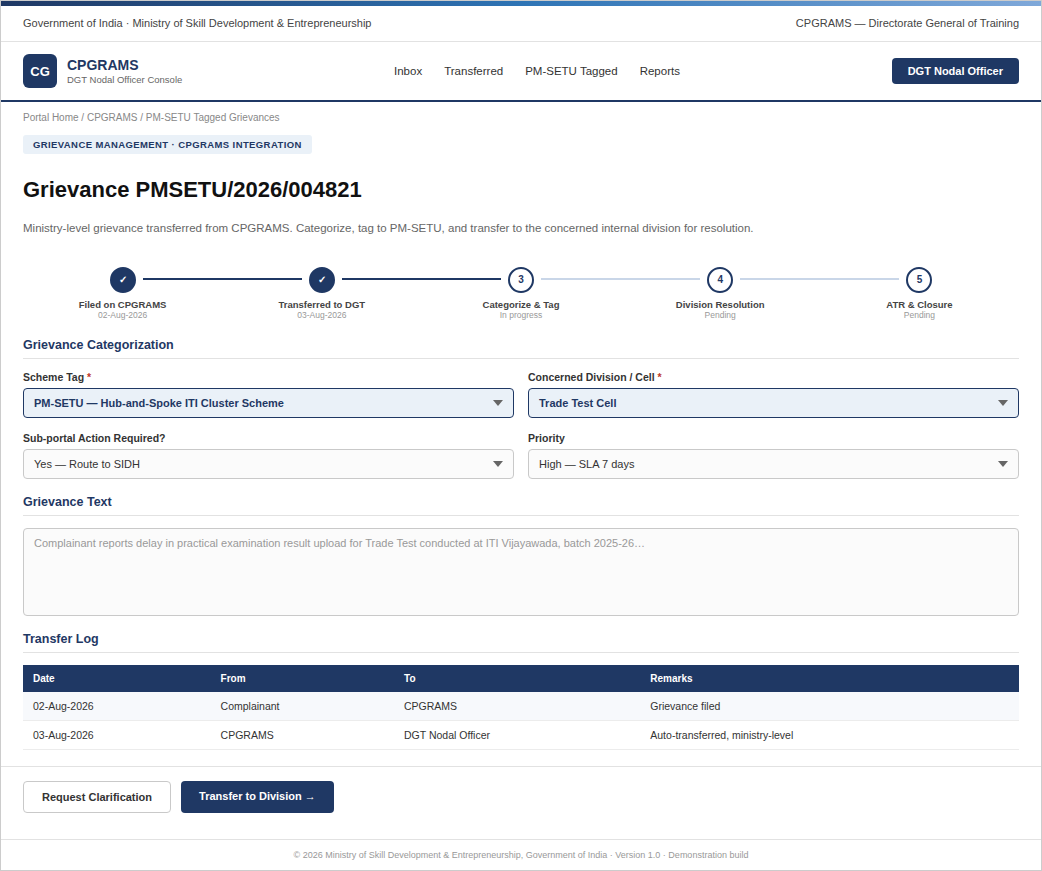
CPGRAMS — DGT Nodal Officer console
Figure 22 — Mockup: CPGRAMS DGT Nodal Officer console for categorization, tagging, and transfer.